Articles in this section
Insights Designer
Feature Availability
Vtiger Editions: One Professional | One Enterprise | One AI
Introduction
Vtiger CRM Insights Designer is an advanced reporting and business intelligence (BI) tool within Vtiger CRM. It allows users to transform CRM data into structured and visually interactive reports.
Organizations store large volumes of data across CRM modules such as Deals, Contacts, Leads, Products, Invoices, and Activities. While this data is critical for operations, meaningful analysis is required to support strategic decision-making. Insights Designer enables users to fetch, process, analyze, and visualize this data directly within the CRM.
With Insights Designer, users can:
- Create structured report pages (Insights)
- Add visualization components (Widgets)
- Fetch data using Queries, APIs, or CSV files
- Transform data using JavaScript
- Display data in tables, pivot reports, charts, funnels, and metrics
- Apply filters for dynamic analysis
- Edit, delete, and manage insights
- Pin reports to dashboards
Insights Designer eliminates the need for exporting data to external tools and enables real-time CRM-based reporting.
Insights Designer Features
Insights Designer follows a layered architecture consisting of Insight, Widget, Input, Transform, Output, and Filters.
Insight
An Insight is a report page that acts as a container for one or more widgets.
Each Insight includes:
- Insight Name
- Assigned User
- Widget layout configuration (widgets per row)
- Filters (optional)
- Widgets
An Insight group's related visualizations into a single analytical view.
Example:
An Insight titled Sales Performance Overview may contain:
- Total Revenue (Metric)
- Revenue by Product (Pie Chart)
- Deals by Owner (Bar Chart)
- Monthly Trend (Line Chart)
Widget
A Widget is an individual report element inside an Insight.
Each widget consists of three configuration layers:
- Input – Defines the data source
- Transform – Modifies data (optional)
- Output – Defines visualization type
Widgets allow modular report building and structured data presentation.
Input
The Input section defines the source of the data.
Query
In this option, the Select field is where you must write the SQL expression or aggregation logic.
You can configure:
- Select – Enter SQL code (for example: round(sum(AMOUNT)) as amt)
- From – Choose the CRM module (Deals, Contacts, etc.)
- Conditions – Filter records using specific criteria
- Group By – Group data based on a field
- Order By – Sort the results
- Limit – Restrict the number of records returned
Webservice Query
Retrieves data through Vtiger’s web service layer. Useful for API-driven reports.
In this option, the Select field is where you must write the SQL expression or aggregation logic.
You can configure:
- Select – Enter SQL code (for example: round(sum(AMOUNT)) as amt)
- From – Choose the CRM module (Deals, Contacts, etc.)
CSV Upload
Allows uploading external CSV files.
Requirements:
- Maximum size: 5MB
- Must include header row
- Maximum 1000 records
CSV data is converted into JSON format before processing.
Custom REST API
Allows selecting APIs created using Vtiger API Designer.
Users can:
- Select API
- Provide request parameters
- Use filter merge tags
- Test responses
Supports integration-based reporting.
History
The History input type is used to fetch historical data related to record updates and activities.
It helps track:
- Field value changes
- Record modification history
- Activity updates
- Status changes over time
This option is useful for:
- Tracking stage movement in Deals
- Monitoring field change history
- Auditing record updates
- Analyzing lifecycle changes
Transform
The Transform tab allows users to modify the fetched data using JavaScript before it is sent to the Output section for visualization.
By default, the system provides a predefined JavaScript function:
var transform = function(result) {
return result;
};
This function simply returns the data as it is, without making any changes.
If you want to alter the data before displaying it in the widget, you can modify the logic inside the function body.
Using the Transform tab, you can:
- Calculate totals
- Rename fields
- Filter specific records
- Aggregate data
- Restructure the result format
- Add computed values
After modification, the transformed data is passed to the Output configuration for visualization.
Output
Defines how data is displayed.
Available Output Types:
- Table
- Pivot
- Metric
- Funnel
- Pie Chart
- Donut Chart
- Bar Chart
- Multi Bar Chart
- Stacked Bar Chart
- Column Chart
- Multi Column Chart
- Stacked Column Chart
- Line Chart
- Multi-Line Chart
Benefits of Insights Designer
Insights Designer provides:
- Real-time reporting inside CRM
- Customizable visual dashboards
- Reduced dependency on external tools
- API-based data integration
- Advanced data transformation capabilities
- Improved decision-making through analytics
- Centralized reporting for departments
- Dynamic filtering and drill-down capability
It transforms CRM data into actionable business intelligence.
In this article, you will learn about:
- Installing Insights Designer
- Accessing Insights Designer
- Creating an Insight
- Adding a Widget
- Editing an Insight
- Editing a Widget
- Deleting an Insight
- Filtering an Insight
Installing Insights Designer
Insights Designer is available as an add-on and must be installed before use.
Follow these steps to install Insights Designer:
- Log in to the CRM.
- Click User Menu.
- Select Settings. The Settings page opens.
- Go to Extensions.
- Click Add-ons. The Add-ons page opens.
- Search for Insights Designer.
- Click Install.
Once installed, the Insights Designer module will be available under Main Menu > Platform > Insights Designer.
Accessing Insights Designer
Follow these steps to access Insight Designer:
- Log in to the CRM.
- Click main Menu.
- Select Platform.
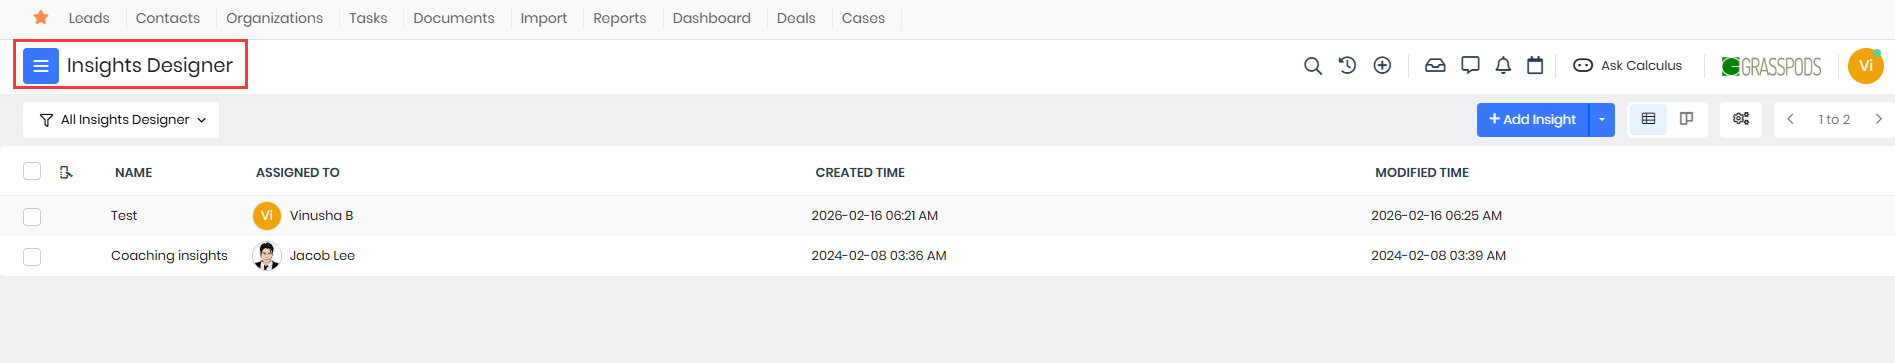
- Click Insights Designer. The Insight Designer page opens.
From here, you can start creating Insights and adding widgets.
Creating an Insight
Follow these steps to create a new Insight:
- Log in to the CRM.
- Click main Menu.
- Select Platform.
- Click Insights Designer. The Insight Designer page opens.
- Click + Add Insight. The Add Insight window opens.
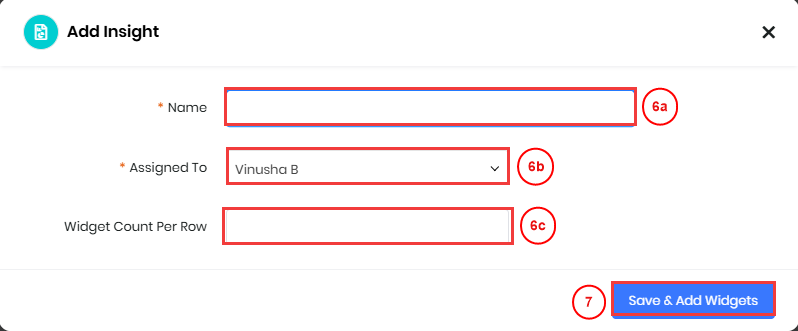
- Enter or select the following information:
- Name – Enter a title to identify the Insight.
- Assigned To – Select the user who will own and manage the Insight.
- Widget Count Per Row – Choose the number of widgets to display in each row of the Insight layout.
- Click Save & Add Widgets.
The Insight is created and added to the List View of the Insight Designer.
Adding a Widget
To add a widget inside an Insight:
- Log in to the CRM.
- Click main Menu.
- Select Platform.
- Click Insights Designer. The Insight Designer page opens.
- Open the Insight to which you want to add a Widget.
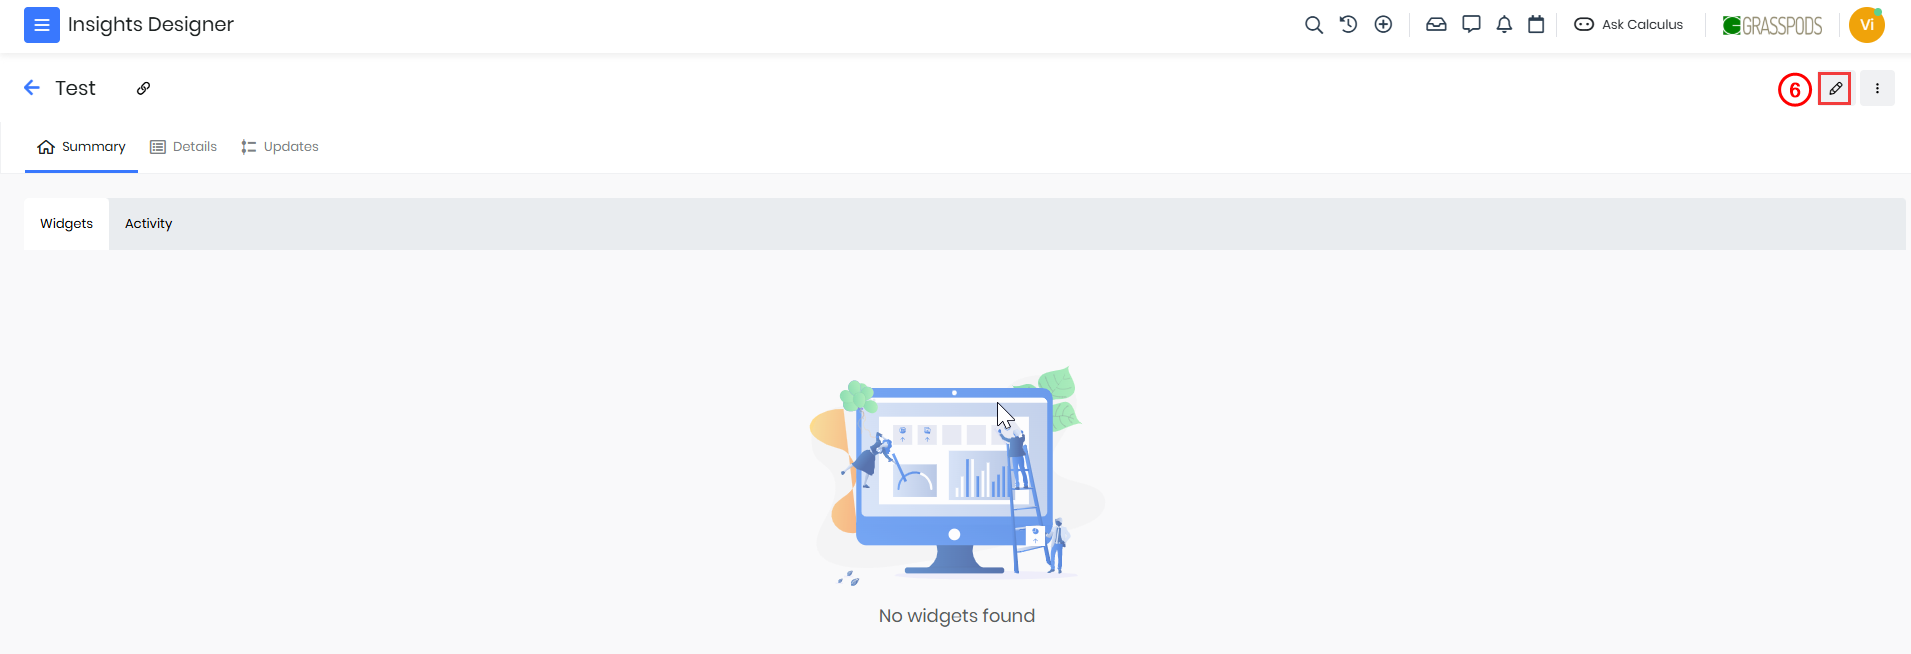
- Click Edit. The Editing Widget page opens.
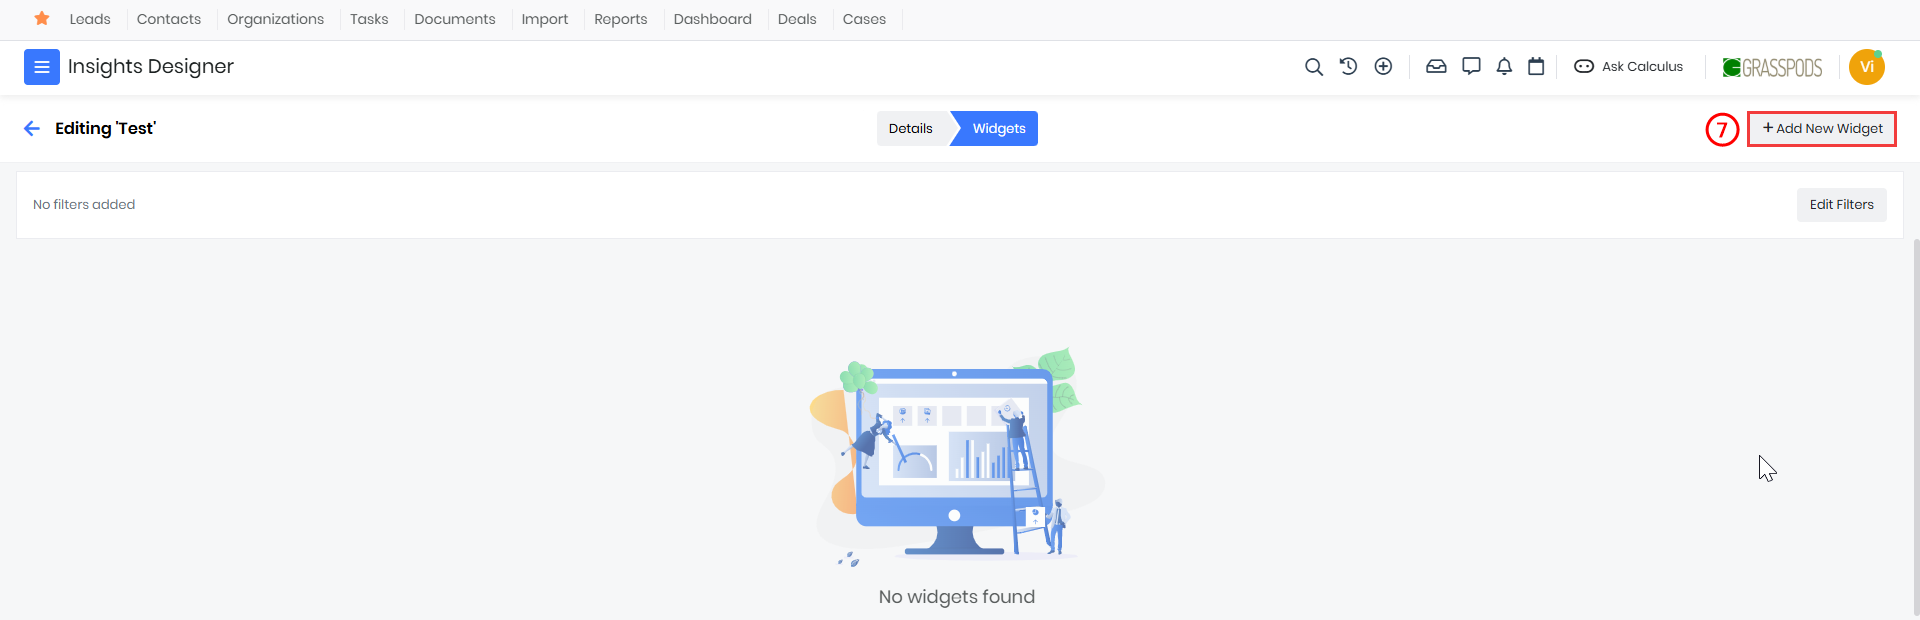
- Click + Add New Widget. The New Widget page opens.
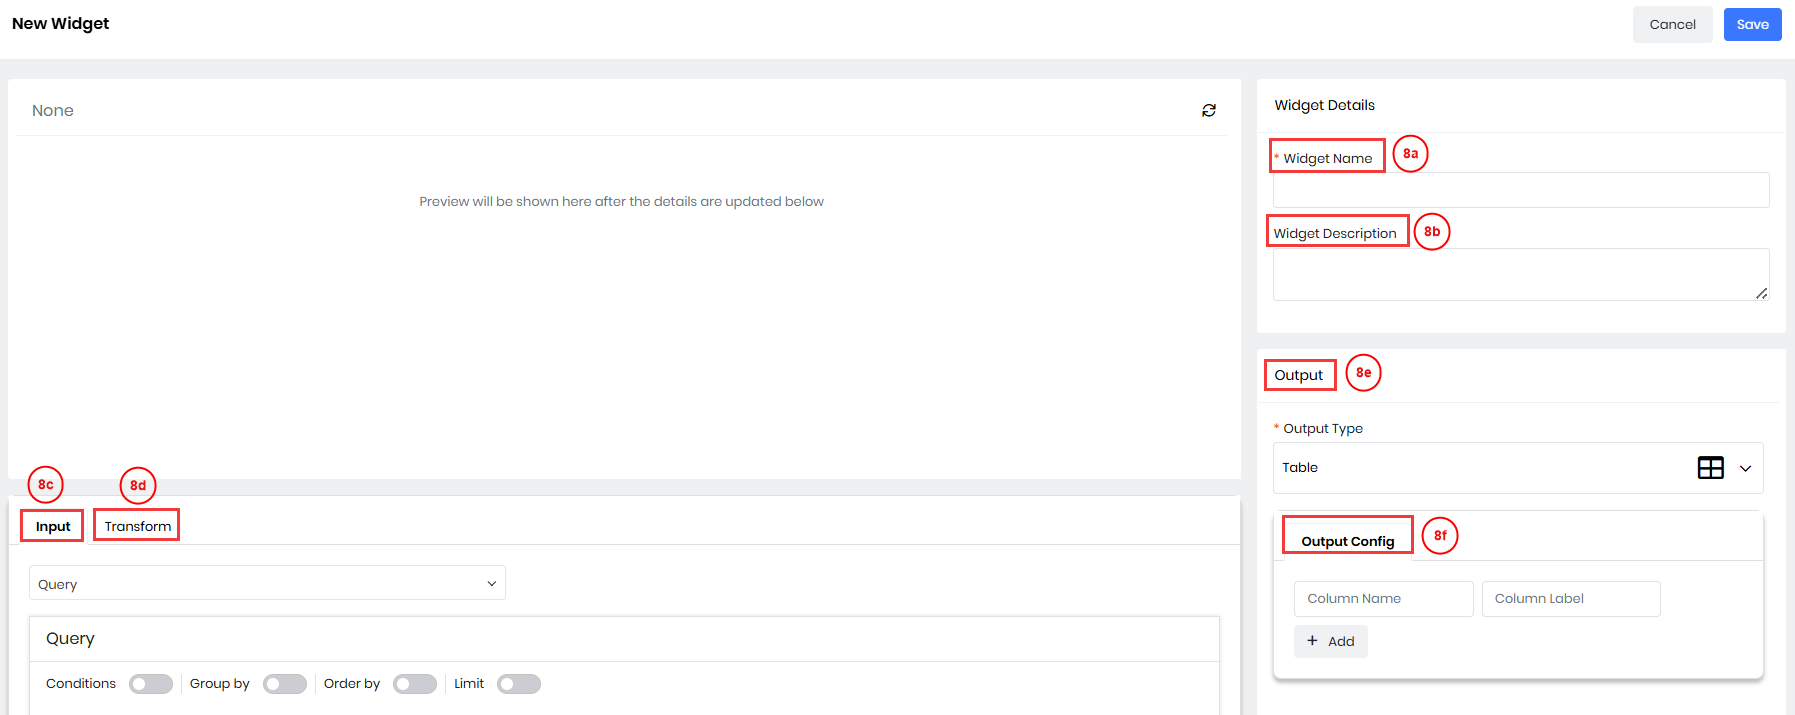
- Enter or select the following information:
- Widget Name – Enter a title for the Widget.
- Widget Description – Provide a brief explanation of what the widget displays.
- Input – Select the data source (Query, Webservice Query, CSV, or Custom REST API) and configure it.
- Transform (Optional) – Modify the fetched data using JavaScript if required.
- Output – Choose the visualization type (Table, Chart, Metric, etc.) and configure it.
- Output Configuration – Configure how the selected output type should interpret the data.
- Click Save.
The widget will display the configured report.
Editing an Insight
You can update an Insight if reporting requirements change.
You can edit an Insight in the following ways:
- List View
- Summary View
List View
Follow these steps to edit an Insight from the List View:
- Log in to the CRM.
- Click main Menu.
- Select Platform.
- Click Insights Designer. The Insight Designer page opens
- Hover over the Insight record that you want to edit.
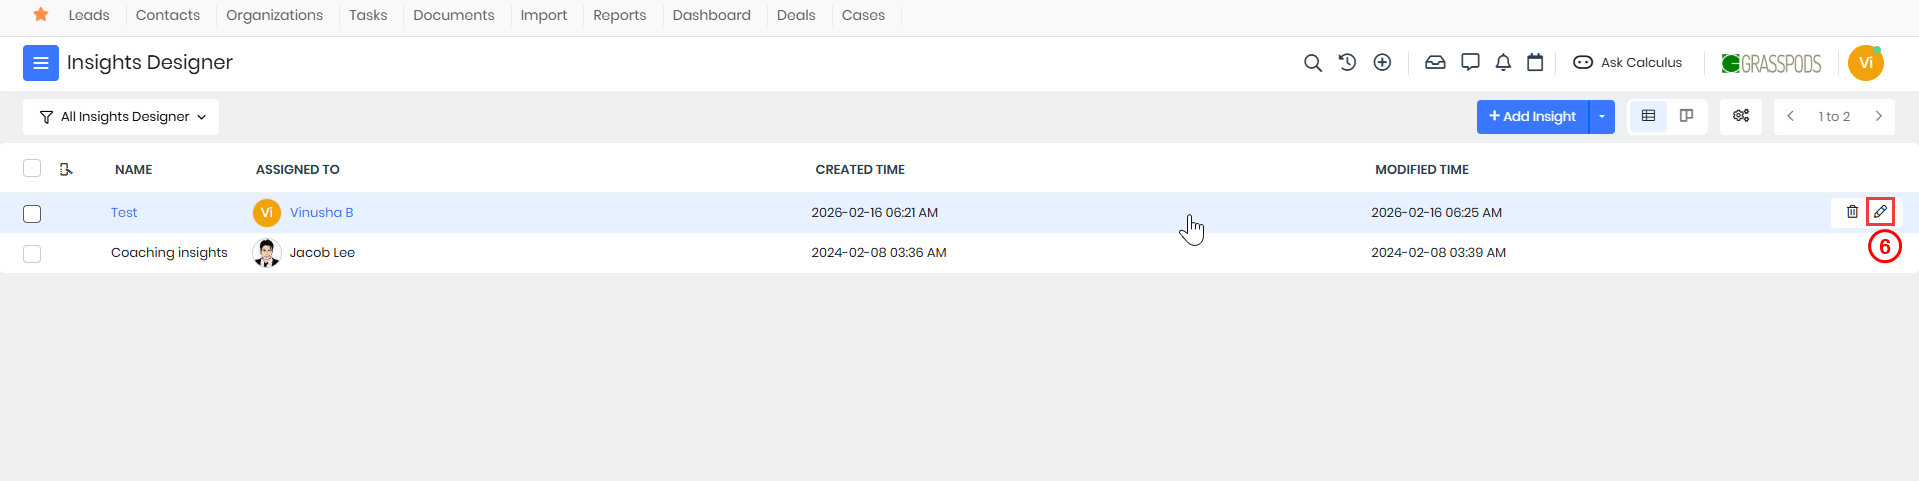
- Click Edit. The Editing Insight opens.
- Enter or select the following information:
- Details – Update the Insight name, assigned user, or widget count per row.
- Widgets – Edit existing widgets or add new ones as needed.
- Click Save.
Summary View
Follow these steps to edit an Insight from the List View:
- Log in to the CRM.
- Click main Menu.
- Select Platform.
- Click Insights Designer. The Insight Designer page opens
- Open the Insight you want to edit.
- Click Edit. The Editing Insight opens.
- Enter or select the following information:
- Details – Update the Insight name, assigned user, or widget count per row.
- Widgets – Edit existing widgets or add new ones as needed.
- Click Save.
Editing a Widget
You can edit a Widget in the following ways:
- List View
- Summary View
List View
Follow these steps to edit a Widget from the List View:
- Log in to the CRM.
- Click main Menu.
- Select Platform.
- Click Insights Designer. The Insight Designer page opens
- Hover over the Insight record that you want to edit.
- Click Edit. The Editing Insight opens.
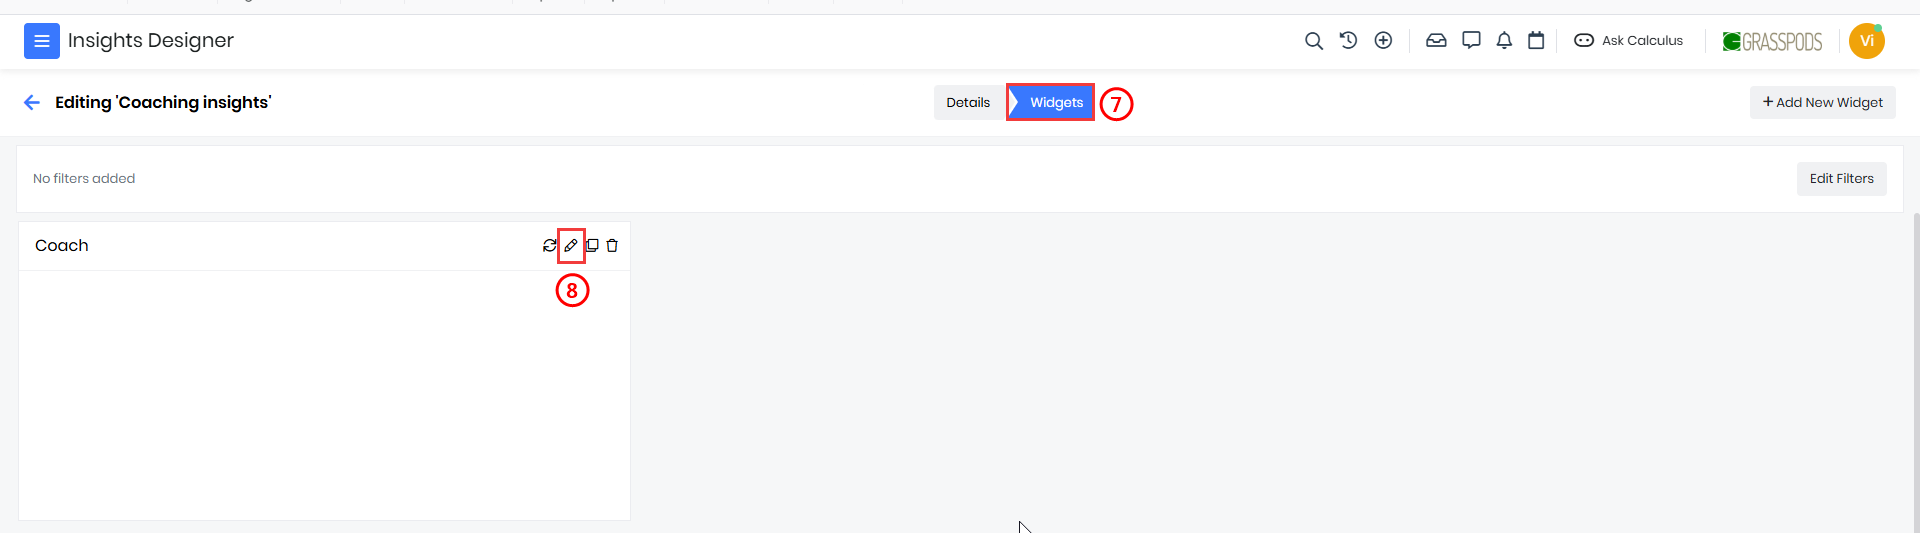
- Go to the Widgets tab.
- Click Edit in the Widget you want to edit. The Editing Widget window opens.
- Enter or select the following information:
- Widget Name – Enter a title for the Widget.
- Widget Description – Provide a brief explanation of what the widget displays.
- Input – Select the data source (Query, Webservice Query, CSV, or Custom REST API) and configure it.
- Transform (Optional) – Modify the fetched data using JavaScript if required.
- Output – Choose the visualization type (Table, Chart, Metric, etc.) and configure it.
- Output Configuration – Configure how the selected output type should interpret the data.
- Click Save.
Summary View
Follow these steps to edit an Insight from the List View:
- Log in to the CRM.
- Click main Menu.
- Select Platform.
- Click Insights Designer. The Insight Designer page opens
- Open the Insight you want to edit.
- Click Edit. The Editing Insight opens.
- Go to the Widgets tab.
- Click Edit in the Widget you want to edit. The Editing Widget window opens.
- Enter or select the following information:
- Widget Name – Enter a title for the Widget.
- Widget Description – Provide a brief explanation of what the widget displays.
- Input – Select the data source (Query, Webservice Query, CSV, or Custom REST API) and configure it.
- Transform (Optional) – Modify the fetched data using JavaScript if required.
- Output – Choose the visualization type (Table, Chart, Metric, etc.) and configure it.
- Output Configuration – Configure how the selected output type should interpret the data.
- Click Save.
Deleting an Insight
Deleting an Insight removes all widgets inside it permanently.
You can delete an Insight in the following ways:
- List View
- Summary View
List View
Follow these steps to edit a Widget from the List View:
- Log in to the CRM.
- Click main Menu.
- Select Platform.
- Click Insights Designer. The Insight Designer page opens
- Hover over the Insight record that you want to delete.
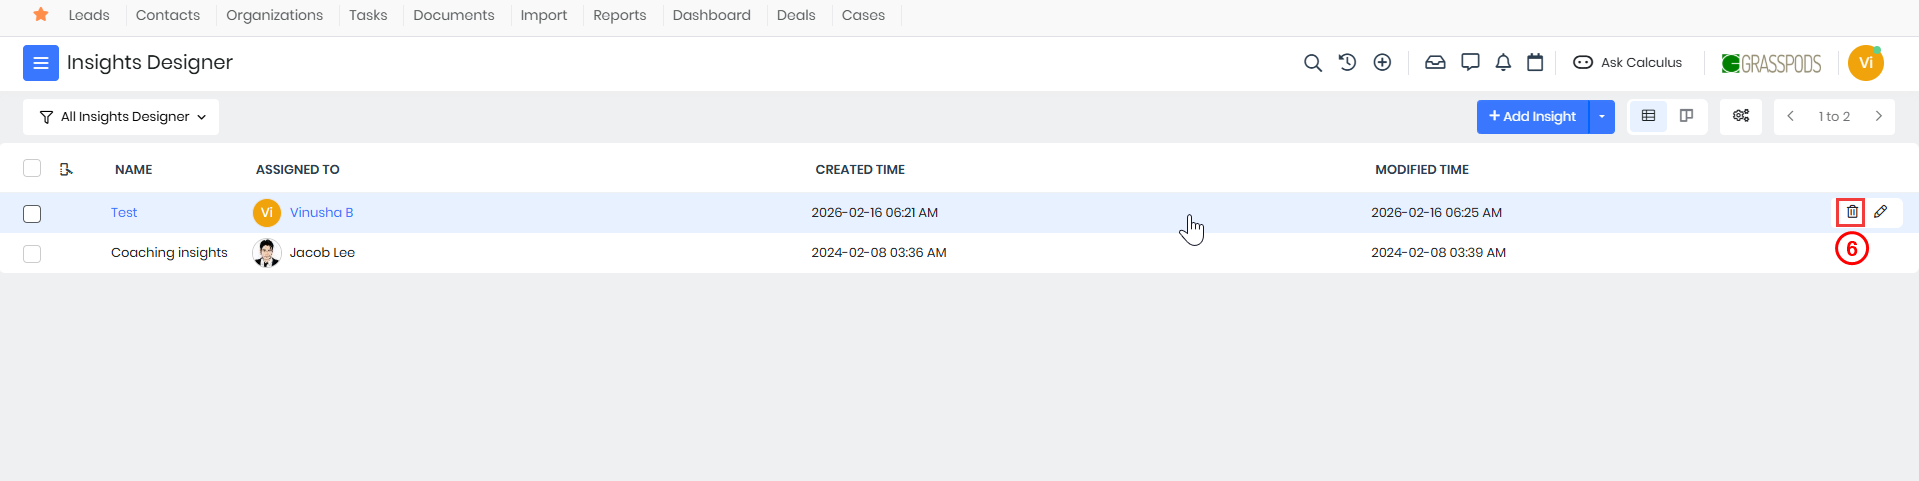
- Click Delete. The confirmation window opens.
- Click Yes, Delete to delete the Widget.
Summary View
Follow these steps to delete an Insight from Summary View:
- Log in to the CRM.
- Click main Menu.
- Select Platform.
- Click Insights Designer. The Insight Designer page opens.
- Click and open the required Insight in List View.
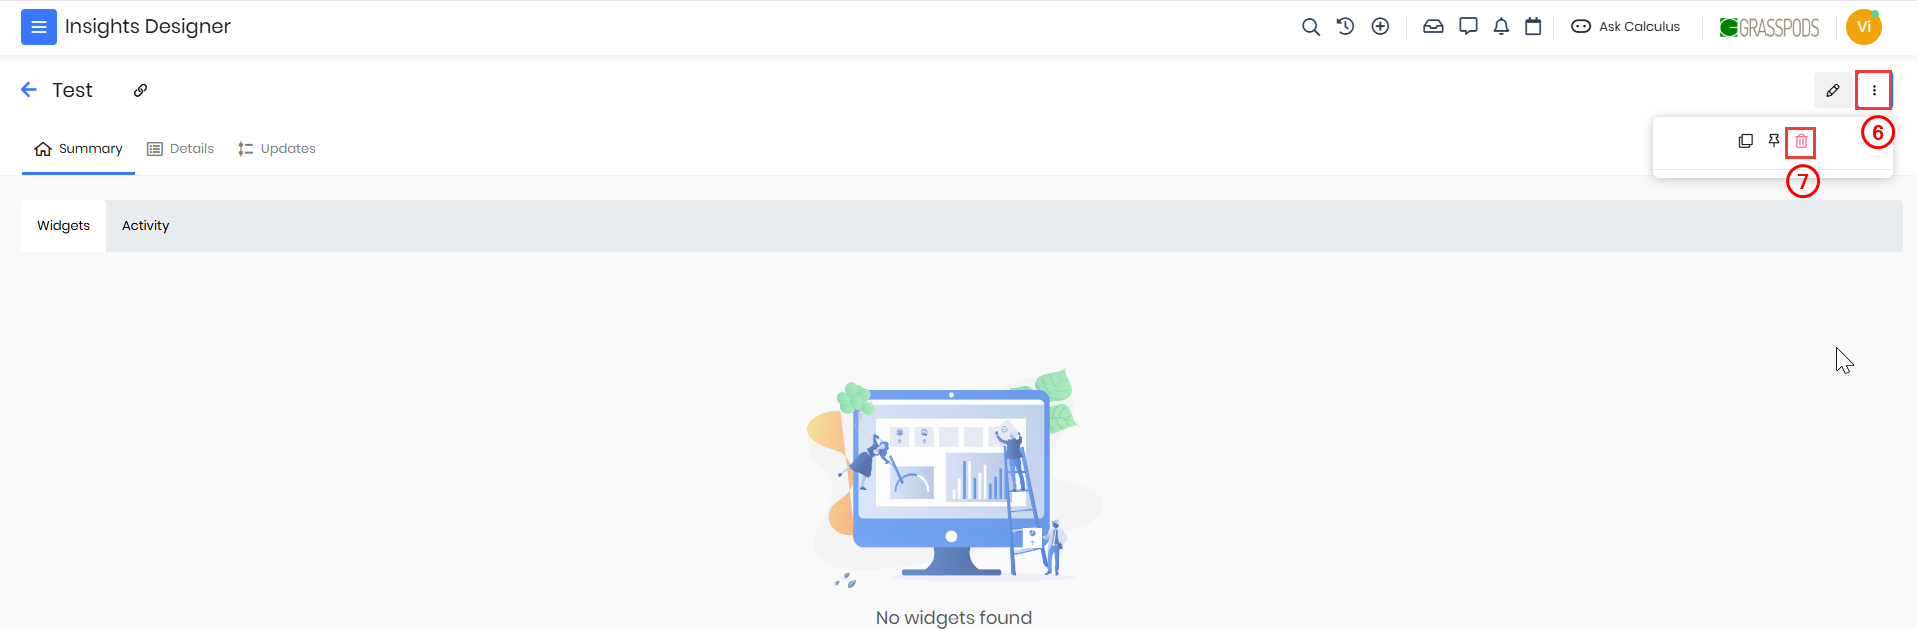
- Click More.
- Click Delete. The confirmation window opens.
- Click Yes, Delete to delete the Widget.
Deleting a Widget
Follow these steps to delete a Widget:
- Log in to the CRM.
- Click main Menu.
- Select Platform.
- Click Insights Designer. The Insight Designer page opens.
- Click and open the required Insight in List View.
- Click Edit.
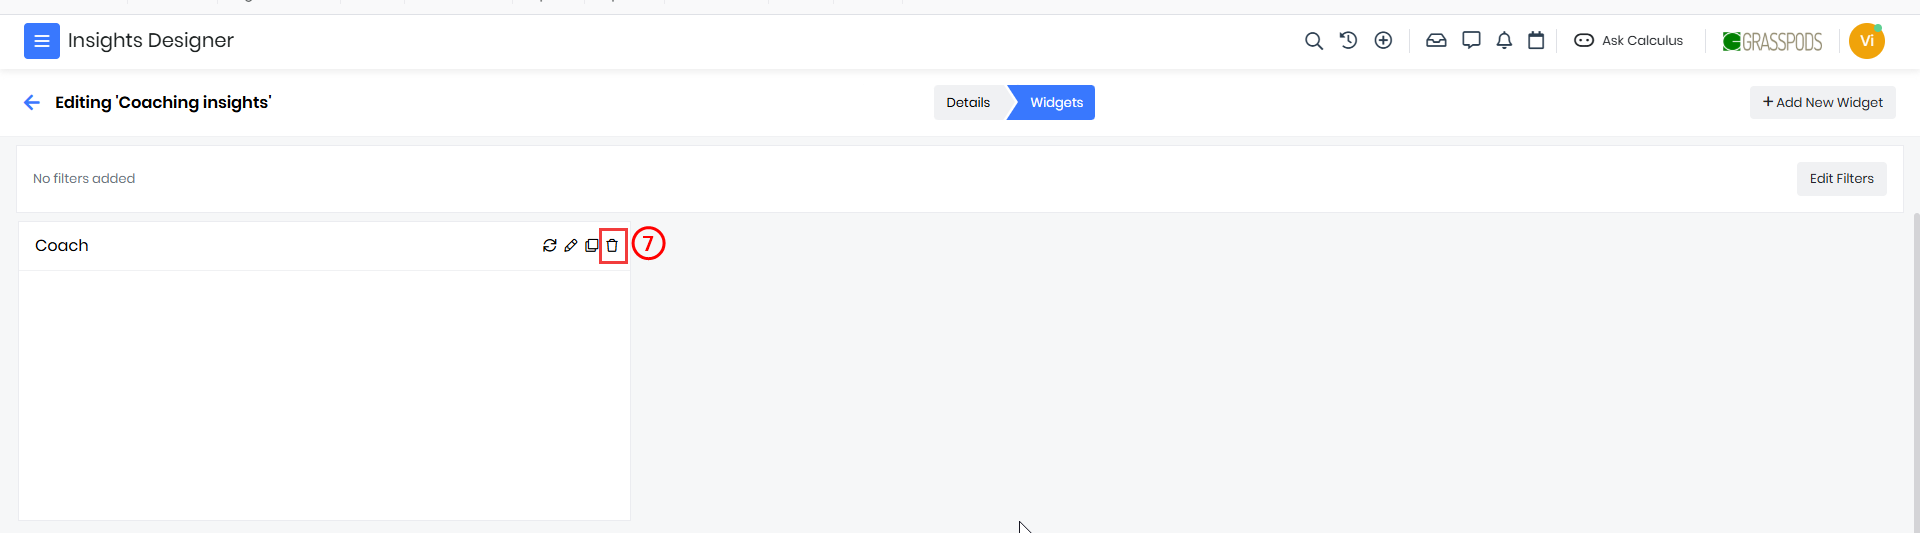
- Click Delete on the widget you want to delete. The confirmation window opens.
- Click Yes, Delete to delete the Widget.
The widget is removed without deleting the entire Insight.
Filtering an Insight
Filters help refine report data without changing widget configuration.
Adding Filters
Follow these steps to add Filters:
- Log in to the CRM.
- Click main Menu.
- Select Platform.
- Click Insights Designer. The Insight Designer page opens.
- Open the required Insight.
- Click Edit.
- Click Edit Filters. The Edit Filters page opens.
- Click + Add Filter.
- Enter or select the following information:
- Field Name
- Filter Type (Text, Date, Owner, Picklist)
- Click Save.
Note: You can add multiple filters to an Insight.
Using Filters
Follow these steps to use filters:
- Log in to the CRM.
- Click main Menu.
- Select Platform.
- Click Insights Designer. The Insight Designer page opens.
- Select values in the filter fields.
- Widgets refresh automatically.
Filters allow real-time drill-down analysis.
Deleting Filters
Follow these steps to delete a filter:
- Log in to the CRM.
- Click main Menu.
- Select Platform.
- Click Insights Designer. The Insight Designer page opens.
- Open the required Insight.
- Click Edit.
- Click Edit Filters. The Edit Filters page opens.
- Click Delete.
- Click Save
Pinning an Insight to the Dashboard
You can pin an Insight to your Dashboard for quick and frequent access. This lets you monitor key reports and metrics without opening the Insights Designer module each time.
Follow these steps to pin an Insight to the Dashboard:
- Log in to the CRM.
- Click main Menu.
- Select Platform.
- Click Insights Designer. The Insights Designer page opens.
- Open the Insight that you want to pin.
- Click More in the top-right corner.
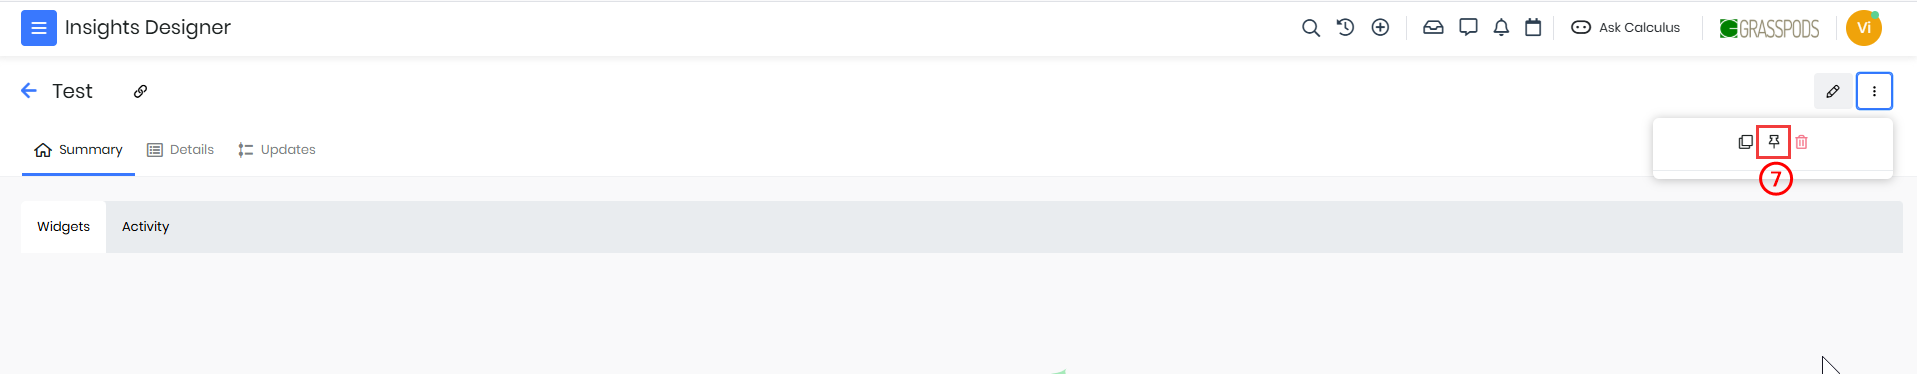
- Click Pin.
The Insight is now pinned to your Dashboard. You can access it from: Dashboard > Filter > Insights.
Reference
DashboardDeals Module in Vtiger