Articles in this section
Insights Designer
Feature Availability
Vtiger Editions: One Professional | One Enterprise
Limitations
- Number of Insights per edition - 5
- Number of Widgets per Insight - 1
To know more about feature limits, click here.
Introduction
If your data is voluminous and distributed across different apps, you need a tool that can pull, analyze, and present data in easy-to-understand charts and graphs.
Vtiger Insights Designer helps you analyze vast amounts of data and build custom reports. The feature provides full control to CRM users to build specific BI reports suited to their needs.
Application and Use Cases
Using the Insights Designer, you can:
- Create an Insight page with multiple report widgets
- Fetch data from different endpoints. It supports the following queries
- Vtiger Webservice query
- Custom Rest APIs from Vtiger API Designer
- Visualize and display data in various modes
- Table
- Pivot
- Different types of charts
- Pin the designed Insight (report) to the Dashboard
- Share generated insights with other users
Insights Designer can be used in a wide range of industries.
Following are a few use cases:
- E-commerce: Insights Designer can help online retailers track and analyze customer behavior, such as browsing and purchasing habits, to optimize their website and product offerings.
- Finance: Insights Designer can be used to analyze financial data, such as stock prices and market trends, to inform investment decisions and predict future market trends.
- Healthcare: Insights Designer can help healthcare providers analyze patient data, such as medical histories and treatment outcomes, to improve patient care and treatment protocols.
- Marketing: Insights Designer can help marketing teams analyze customer data to develop more targeted and effective marketing campaigns.
- Supply Chain Management: Insights Designer can analyze supply chain operations data, such as inventory levels and shipping times, to optimize supply chain efficiency and reduce costs.
- Social Media: Insights Designer can help social media managers track and analyze user engagement metrics, such as likes and shares, to inform content creation and marketing strategies.
- Education: Insights Designer can be used to analyze student data, such as test scores and attendance records, to inform curriculum development and improve student outcomes.
Insights Designer Components
The following are the components available in the Insights Designer:
- Insight - A record in the Insights Designer module is called an Insight.
- Widget - Each report inside an Insight is called a Widget.
- Input - Data sources that are used to fetch the data.
- Transform - Ability to write javascript code to alter the data if needed.
- Output - Where you can set up the output details for data visualization.
Let us learn more about these widgets.
Input
This is where you can configure the input data source - from where data will be fetched. The Insight Designer supports multiple input types - Query, Webservice Query, and CSV.
Raw Query support is available on an on-demand basis only.
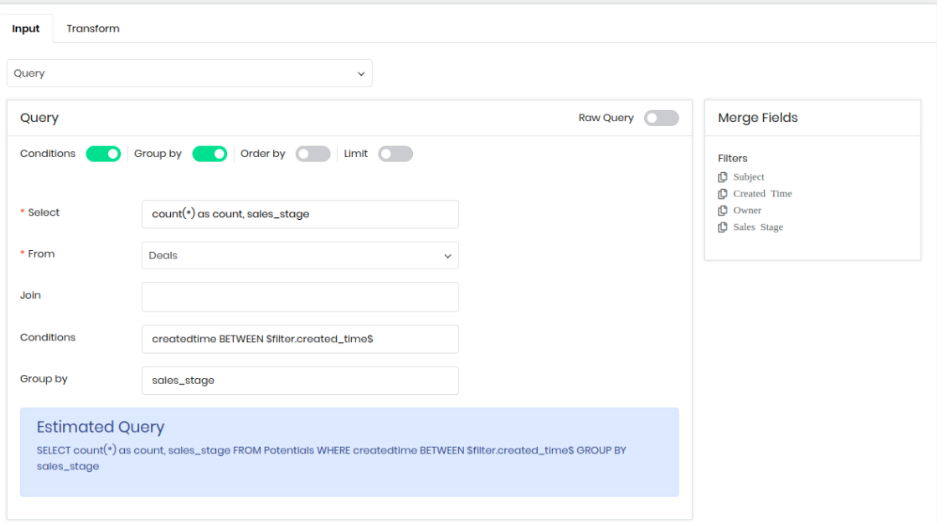
- Query: If you want to fetch data directly from your instance Database, you can use this data source. When you select this source, the system gives you a Vtiger Query builder where you can fill in details to build the Query. After filling in the details, an estimated query will be shown at the bottom.

You can see Merge Fields on the right-hand side of Input. Those are the filters you enabled in Insight. You can use filters to add conditions to your insight. Clicking on the Merge Field will copy the merge tag to the clipboard. You can then paste it in the conditions at the required position.
- Webservice Query: The behavior of this data source is the same as the Query, but this will accept only Webservice queries. The query support in Vtiger web services can be built from this data source.

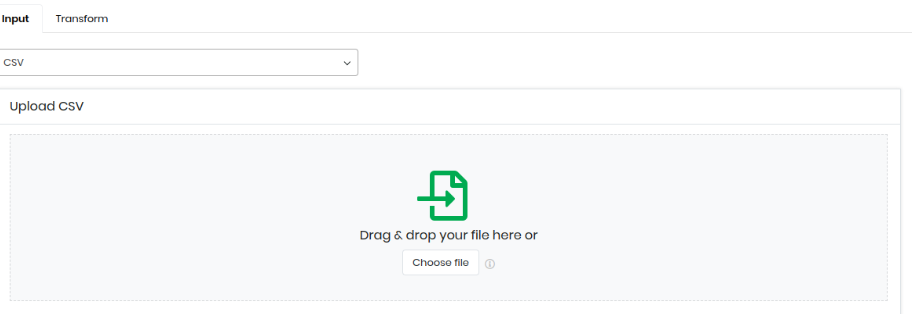
- CSV: Sometimes, you may receive information in a CSV file - an exported file from Google Sheets or any other 3rd party application. You can upload the CSV to an Insight Widget and configure it to display the data in the preferred output. You can upload a file up to 5MB.
|
|
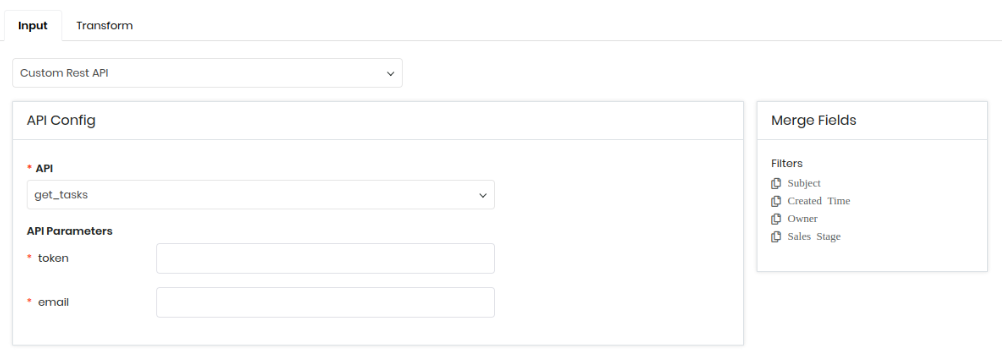
 Custom Rest API: The Vtiger API Designer is a useful tool that you can use to build custom Rest APIs to connect with different applications. The Insight Designer lets you use custom Rest API as the input source. You can create custom REST APIs and connect them to the Insights Designer to help you fetch data from different external applications.
Following is the flow to use a custom REST API in the Insight Designer:
- Select the required API from the list of all the available APIs using the drop-down.
- Request parameters are displayed if enabled in the selected API. (All request parameters are mandatory).
- Fill in the details to test the API and fetch the response.
- If request parameters are based on the filters, copy the filter merge tag and paste it into the API Parameter value.
|
|
Transform
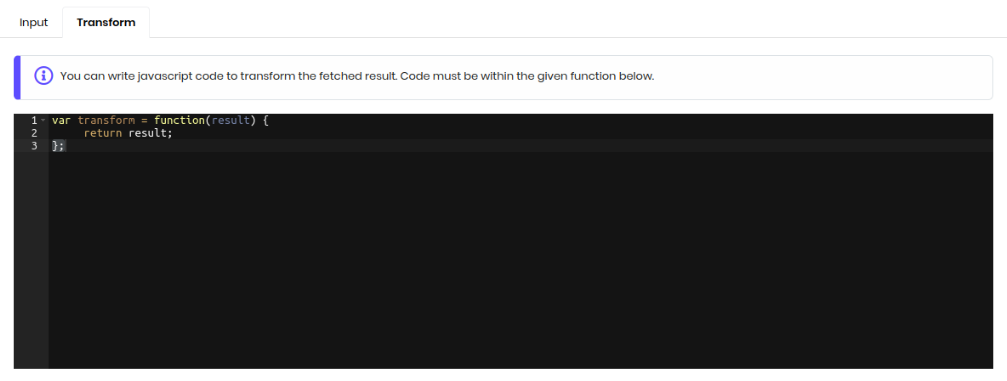
The Transform tab will help you write a javascript code to transform the data you fetch from the data source. The code in the Transform tab will act on the fetched data and apply the required changes. The transformed data will then be moved to Output for visualization.
Transform is auto-populated with the default javascript function, which returns the data as is. If you want to alter the data before the display, you can update this function and make changes. 
|
|
Output
This is where you can set up the output configuration. That is, you configure the format in which the data must be displayed in the widget.
You can visualize or display the output in the following types of reports:
- Table
- Pivot
- Metric
- Pie Chart
- Donut Chart
- Bar Chart, Multi Bar, Stacked Bar
- Column Chart, Multi-Column, Stacked Column
- Line Chart, Multi-Line
You will need to configure the widget display when selecting the output type. Let us consider an example for each.
- Table: By default, column names from the result are shown in Camel case text. You can add the column name in this configuration if you want to show different labels for each column. Columns are displayed only if you add different labels.
- Pie chart: It expects the Label to categorize each Value. So you must fill in what column must be used as Label and Value from the result.
- Multi-column chart: It expects Category and Subcategory to group the Values. So you must fill in the columns that must be used, such as Category, Sub Category, and Value, from the result.
- Pivot: It expects group by rows, group by columns, and value columns.
- Metric: Metric is the count value that you want to display. The column in which you want this count must be configured.
Resultant columns from the Input source from which the data is fetched and transformed must be used in this configuration.
Line Item Fields
You can generate reports in the Insights Designer with the following values - Item name, Quantity, Net Price, and Grand total.
You can generate a report with line item field-level data for the following:
- Products (Item name)
- Quantity - Quantity of items (Products count in all deals)
- Net Price - for getting SUM of all the deals
- Product Category
- Product sub-category
Benefits
The following are the benefits of using the Insights Designer:
- Create custom reports for different departments.
- Display actionable insights for easy understanding of what actions need to be taken.
- Use APIs to create automated and filtered reports.
In this article, we will learn about the following:
- Accessing Insights Designer
- Creating Insights page
- Enabling Filters for a Report
- Creating a Widget
- Pinning Insights to Dashboard
Key Terminology
|
|
|
|
|
|
|
|
|
|
|
|
Accessing Insights Designer
The Insights Designer in the CRM comes with its module.
Follow these steps to access Insights Designer:
- Log in to your CRM account.
- Click the Main Menu.
- Click Platform.
- Click Insights Designer. The List View of Insights is displayed.
Creating Insights Page
Creating an insight or a report involves the following:
- Adding an insight
- Adding a widget
Adding an Insight
Follow these steps to create an Insights page:
- Log in to your CRM account.
- Click the Main Menu.
- Click Platform.
- Click Insights Designer.
- In the List View, click +Add Insights. Add Insight window pops up.
- Enter or select information for the following:
- Name: Enter a name for the insight.
- Assigned to: Select a user from the drop-down.
- Click Save & Add Widgets. The Editing Insights page opens.
Adding a Widget
Follow these steps to create a widget:
- In the editing view, click +Add New Widget.
- Enter or select information for the following:
- Widget Details:
- Widget Name: Enter a name for the widget.
- Widget Description: Enter a brief description of the widget.
- Input:
- Query Type: Select the input query type from the drop-down.
- Based on the query type selected, select the dependent field.
- Transform (Depends on the Input):
- You can write javascript code to transform the fetched result.
- Output (Depends on the Input):
- Output Type: Select the type of output widget from the drop-down.
- Output Configuration: It depends on the Output Type selected in the previous step.
- Widget Details:
- Click Save.
Enabling Filters for a Report
You can enable filters to an insight you are generating. Filters help you drill down data under different parameters to under the data source better. For example, you can enable filters such as Text, Picklist, Date, and Owner types.
Follow these steps to enable filters for a report:
- Log in to your CRM account.
- Click the Main Menu.
- Click Platform.
- Click Insights Designer.
- In the editing view, click Edit Filters. Filters pop up appears.
- Click +Add Filter.
- Enter the field name to capture the data.
- Select the type of filter from the drop-down.
- Text: The system will filter the data based on a text or keyword in the record.
- Date: The system will filter the data based on the date in the record.
- Owner: The system will filter the data based on the owner of the record.
- Picklist: You can add a drop-down of filters. The system will filter the insights based on the filters from the drop-down.
- Click Save.
Pinning an Insight to Dashboard
You can pin the insights to your dashboard to access them quickly and frequently.
Follow these steps to pin an insight to the Dashboard:
- In the List View, click the required Insight.
- Click the More icon in the top right corner.
- Click the Pin icon.
The insight is now successfully pinned to your dashboard. You can find the Insight page under Dashboard > Filter > Insights section. You can also share this Dashboard with any user like other dashboards.