Articles in this section
Reports and Analytics in Vtiger
Feature Availability and Limits
| One Pilot | One Growth | One Professional | One Enterprise | One AI | |
| Feature Availability | |||||
| Custom Reports | ✓ | ✓ | ✓ | ✓ | ✓ |
| Scheduled Reports | - | ✓ | ✓ | ✓ | ✓ |
| Custom Scheduled Reports | - | ✓ | ✓ | ✓ | ✓ |
Introduction
Reports display data in an organized manner in the form of tables, graphs, and charts. You can use Vtiger Reports to extract data relevant to your team from multiple records in the CRM. These reports will help draw conclusions and make insightful decisions.
Types of reports
In Vtiger CRM, you can create the following report types:
- Detailed reports (Granular data in tabular format)
- Pivot reports (Aggregated data in tabular format)
- Chart reports (Graphical data)
You can also create a combination of reports, such as:
- Detailed and chart reports
- Pivot and chart reports
You have the option of creating only detailed, pivot, or chart reports by filling out only specific details. For example, to create a Pivot report, you must select pivot columns and data fields that need to be displayed in the report.
Types of charts
In Vtiger CRM, you can create the following chart types:
- Pie chart
- Column chart
- Bar chart
- Line Funnel chart
Note: You can also change the report’s owner’s name, provided you are an Admin user. For example, when an employee leaves a company, you can assign the reports they have generated to a different owner
Scheduling a Report
You can schedule a report to run it at a fixed time and frequency and receive email updates.
Scheduling reports saves you from the trouble of creating the same report regularly to see updates. A scheduled report runs at a fixed frequency on the conditions chosen by you, also sends you an email.
Note: Scheduled reports are generated automatically under Administrator privilege. This means that sharing rules are ignored, and hence restricted data can be exposed to the recipients, so wisely choose the recipient in the To and CC sections.
Reports to view CRM user activity
You can use the following conditions to generate reports on user activity in the CRM:
- Last Login Report
- User Activity Summary Report
- Overall Activity Report
- Activity Trends Report
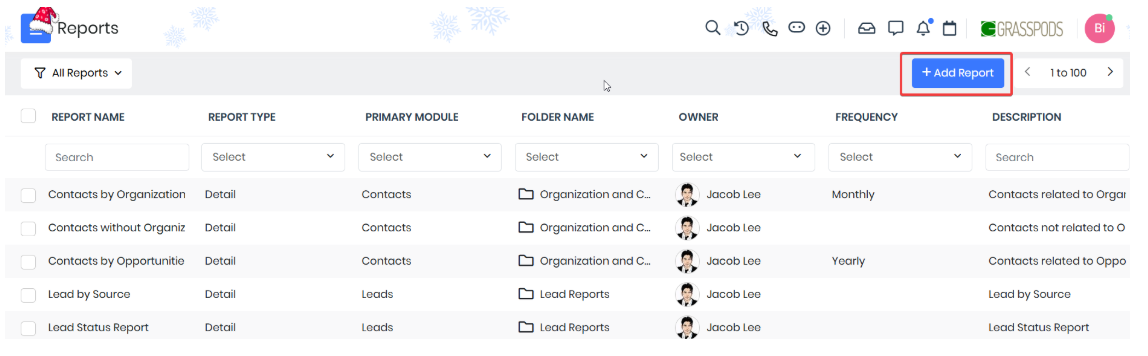
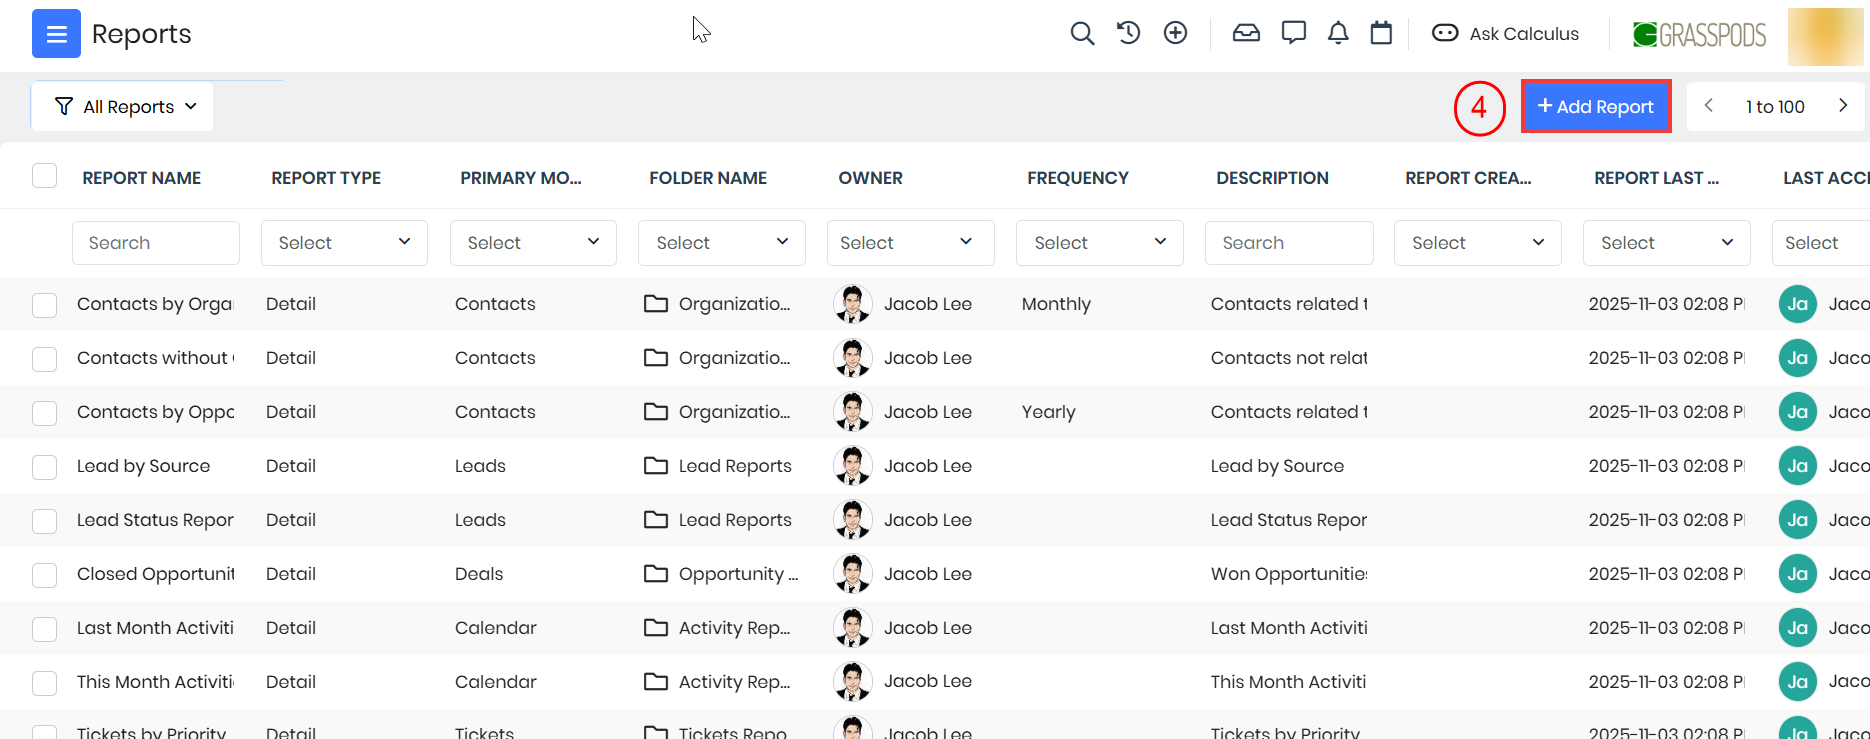
You can view or create reports by going to Main Menu > Essentials > Reports. You will land on the List View of Reports.
Key Terminology
| Key Term | Definition |
| Report Name | Displays the name of the report |
| Report Folder | Displays the name of the folder in which the report resides |
| Primary Module | The name of the module on whose records the report is created |
| Related Module | The additional modules required to pull data from their records |
| Share Report | The users, roles, or groups with whom you want to share the report |
Creating a Report
Note: This process requires you to enter information in four tabs - Details, Properties, Filters, and Charts.
Follow these steps to create a report:
- Log in to the CRM.
- Click the Main Menu.
- Go to Essentials.
- Select Reports.
- Click +Add Report. The Add Report window opens.
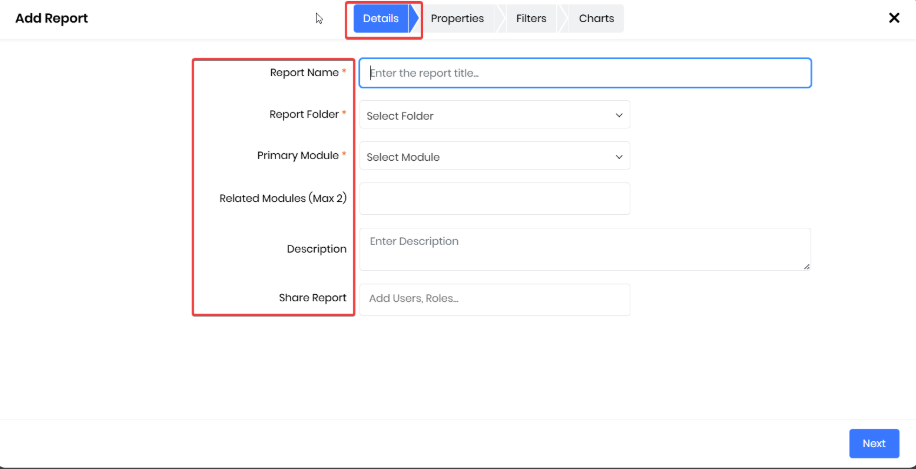
- Enter or select information for all the mandatory data fields -
- Details tab: Enter the basic details of the report.
- Report Name - Enter the report name.
- Report Folder - Select the folder where you want to place the report.
- Primary Module - Select the primary module on which you want to generate the report.
- Related Modules (Max 2) - Choose a maximum of two secondary modules to generate the report.
- Description - Enter a small description of your report.
- Share Report - Select the users with whom you want to share the report.
- Click Next. The Properties tab opens.
- Properties tab: Choose what data to show and how to group report data. You can see a report preview under this tab, and remove the unwanted column by clicking the X mark.
- Select fields under Group by Row based on which report data will be grouped or sorted.
- Select fields under Group by Column based on which the report data will be grouped or sorted.
- Select Data Fields to display in the report.
- Or,
- Hold and drag the Data Fields from the list on the left side of the screen into the previewed report.
- Note: Selecting RTE fields in ODATA is restricted.
- Click Save and Run to preview the report.
- Or,
- Click Next to specify filters and charts.
- Enable the My Preferred Currency field to display the report in a column using the selected Preferred Currency (currency code). For example, you can generate a Deal report with values for both the Deal Currency and your Preferred Currency. This will help you analyze the Deal revenue in your preferred currency.
- Filters tab: Set up All Conditions if you want to apply multiple conditions, and all of them must be satisfied to pull data for the report. Set up Any Conditions if you want to apply multiple conditions, and at least one of them must be satisfied to pull data for the report.
- Click +Add Condition under the required filter.
- Select a Field from the drop-down.
- Select a Condition from the drop-down.
- Enter a Value that satisfies the condition set up.
- Click the Delete icon to eliminate a condition.
- Click Save and Run to preview the report.
- Or,
- Click Next to specify the types of charts required in the report.
- You can use the Year to Date filter condition for the date field. This option can be used to generate annual reports with the inclusion of current dates. For example, you can calculate YTD opportunities won or planned visits by fetching records from January 1 to the current date.
- Note: This is similar to the Sort by Date filter available in Dashboards.
- Charts tab: Select a chart type to generate a report.
- Select the Chart Type from the drop-down.
- Select the Sub Type if available.
- Enter the Chart Title.
- Enter the remaining Chart Properties that vary depending on the chart selected.
- Click Remove to delete the chart type.
- Click Save and Run.
- Details tab: Enter the basic details of the report.
Note:
- You can group and display data by Date and Time fields in hourly intervals, such as Created Time (Hours) or Modified Time (Hours).
- For example, records created between 9:00 AM and 9:59 AM will appear under the 9:00 AM row. This feature is available for all modules with Date and Time fields, including Created Time, Modified Time, Event Start and End Date and Time, and custom DateTime fields.
- When a report has a multi-currency field, the Record Currency and Record Conversion Rate columns are added to the report by default. An example of a multi-currency field is the Amount field in the Deals module.
Using Group By fields
Group By helps group data based on a single condition in a report. With this, you can avoid having multiple rows or columns of duplicate data. 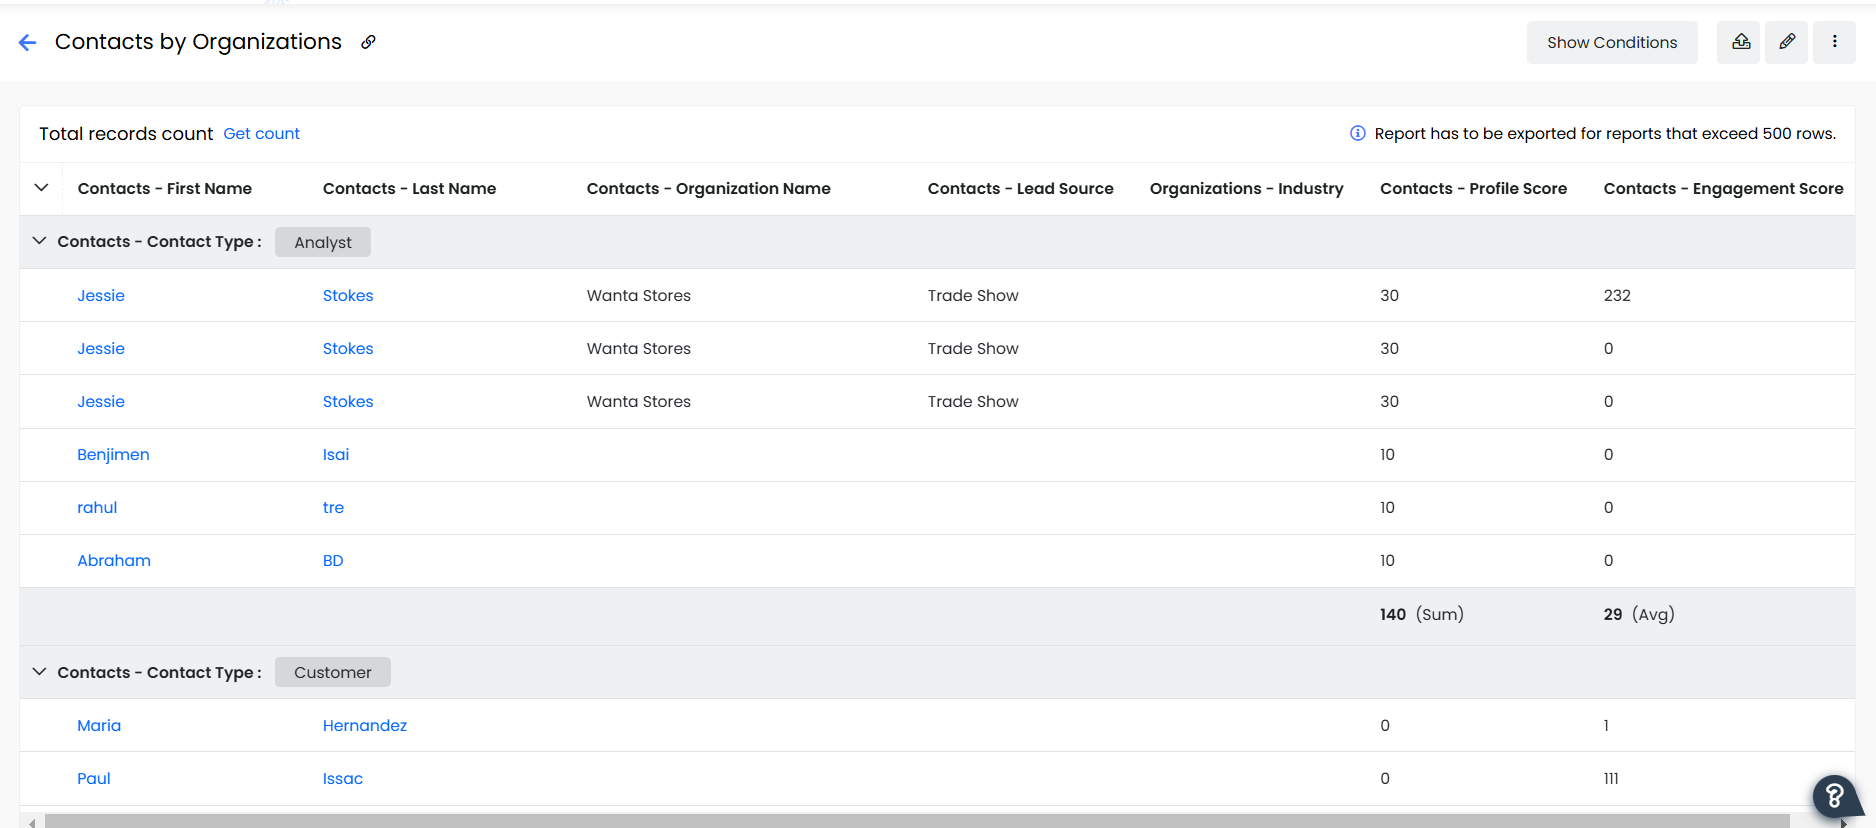
For example, you create a report on the Contacts module and select First Name and Last Name as the data fields. If you have 10 contacts and five of them have the same First Name, you can group report data by First Name. In this case, you will see five rows of Last Name with one merged row of First Name. Review the image above.
If you select both Group By Row and Group By Column, you must select a Data Field to display information in the report. 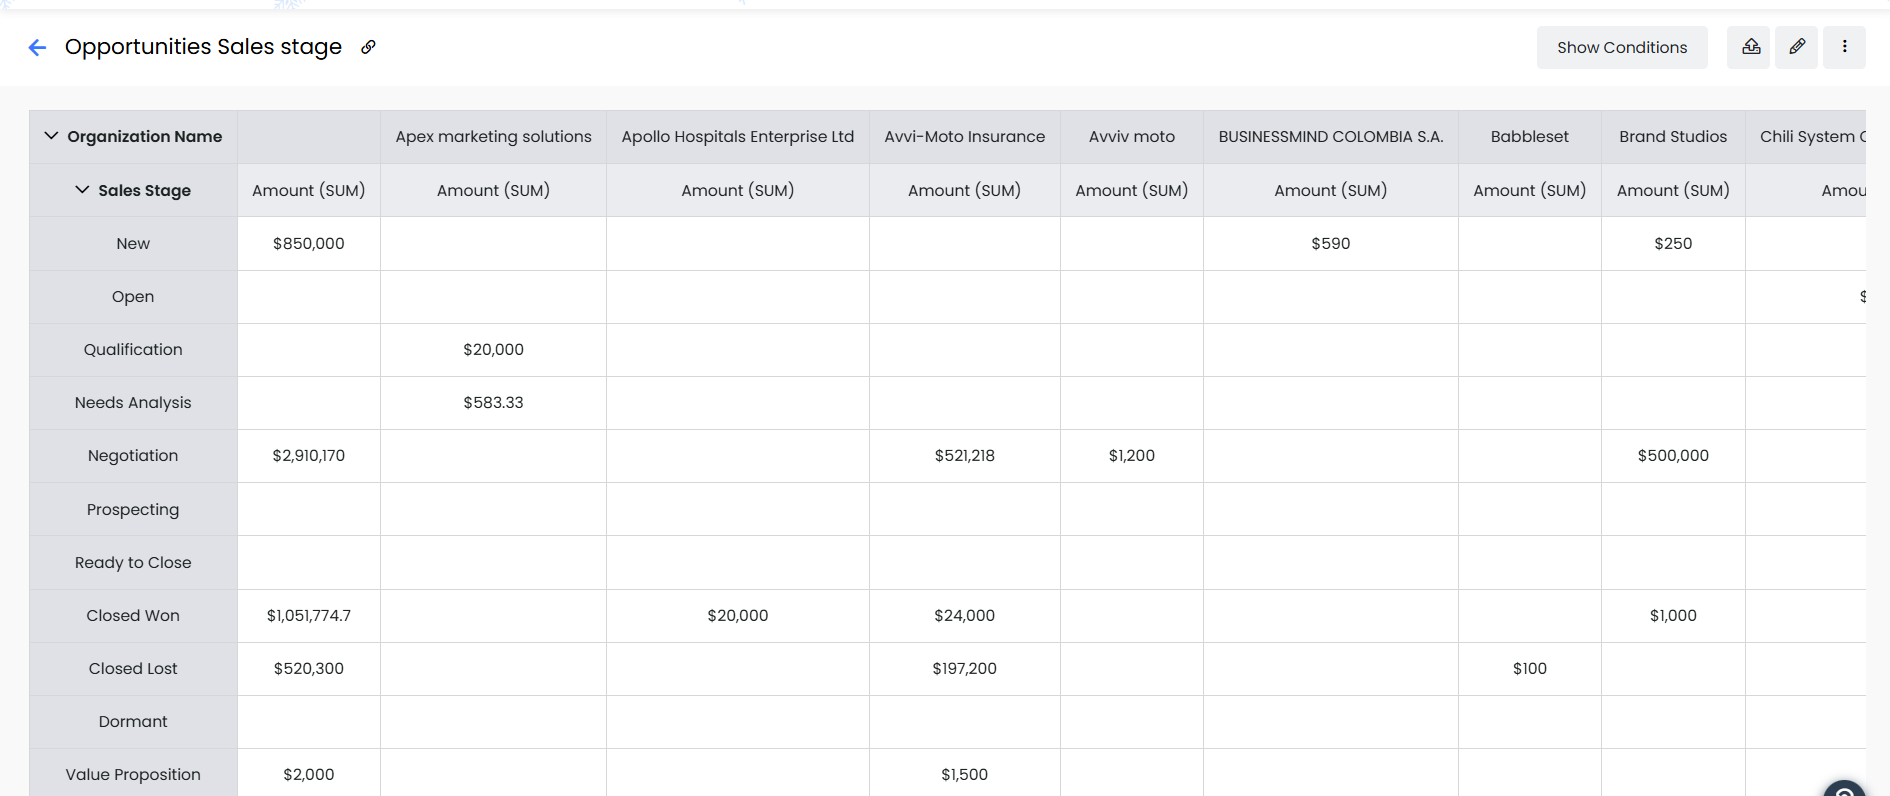
For example, you create a report for the Deals module and select Record Count as the data field. Going further, you select the Deal Name under Group By Row and Sales Stage under Group By Column. The report will display the number of deal records per combination of Deal Name and Sales Stage.
Calculations in data fields
You can display the following data in data fields in a report:
- Sum (SUM) - The sum of data field values
- Average (AVG) - The average of data field values
- Minimum (MIN) - The minimum of the data field values
- Maximum (MAX) - The maximum of the data field values
Time in Reports
You can see the time spent on a Project Task in the hours and minutes (hh: mm) format in reports generated for tasks and cases. This format is available for the following fields:
- Total Time Spent on Subtasks
- Billable Time Spent
- Total Time Spent
Generating Top N Records Using Record Limit
Dynamic sorting and ranking allow you to create Top N reports using the Record Limit field, helping you focus on the most relevant leads, deals, or quotes.
For example, you can view the top 10 leads by deal size, the top 5 deals for the current month, or the top 10 industries based on leads generated. This helps reduce unnecessary data, highlight useful insights, and focus on high-value opportunities.
Consider generating a report showing the top 5 sales representatives by total deal value.
Note: Enable Top N Records in the Properties tab to view reports with a limited number of top records.
Follow these steps to generate the report:
- Log in to the CRM.
- Click the main Menu.
- Go to Project Analytics > Reports. The List View of Reports opens.
- Click +Add Report.
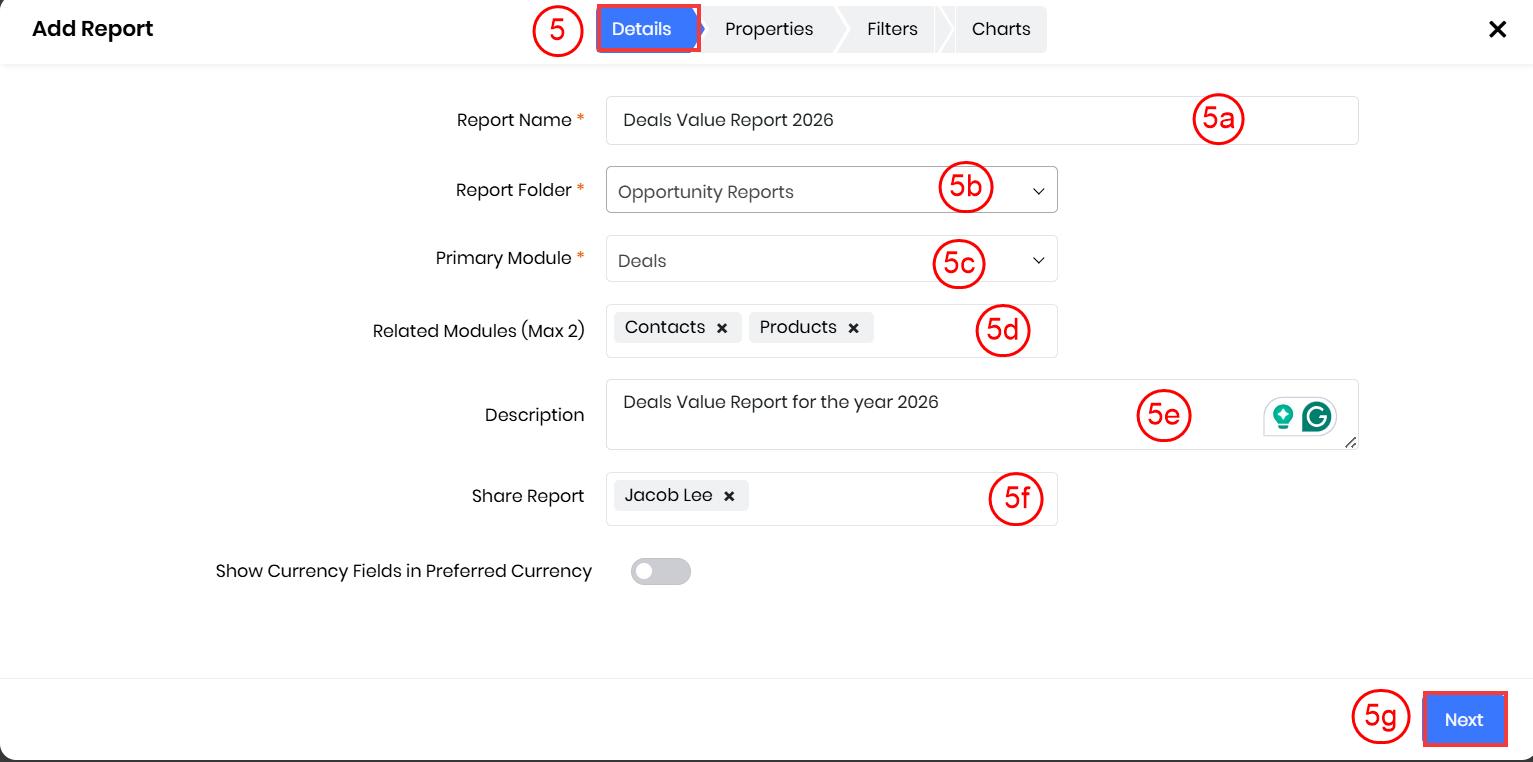
- Enter or select the following information in the Details tab:
- Report Name: Enter the report name.
- Report Folder: Select the folder in which you want to place the report.
- Primary Module: Select the primary module os Deals.
- Related Module (Max 2): Choose a maximum of two secondary modules to generate the report.
- Description: Enter a brief description to summarize the purpose or details of the report.
- Share Report: Select the users you want to share the report with.
- Click Next.
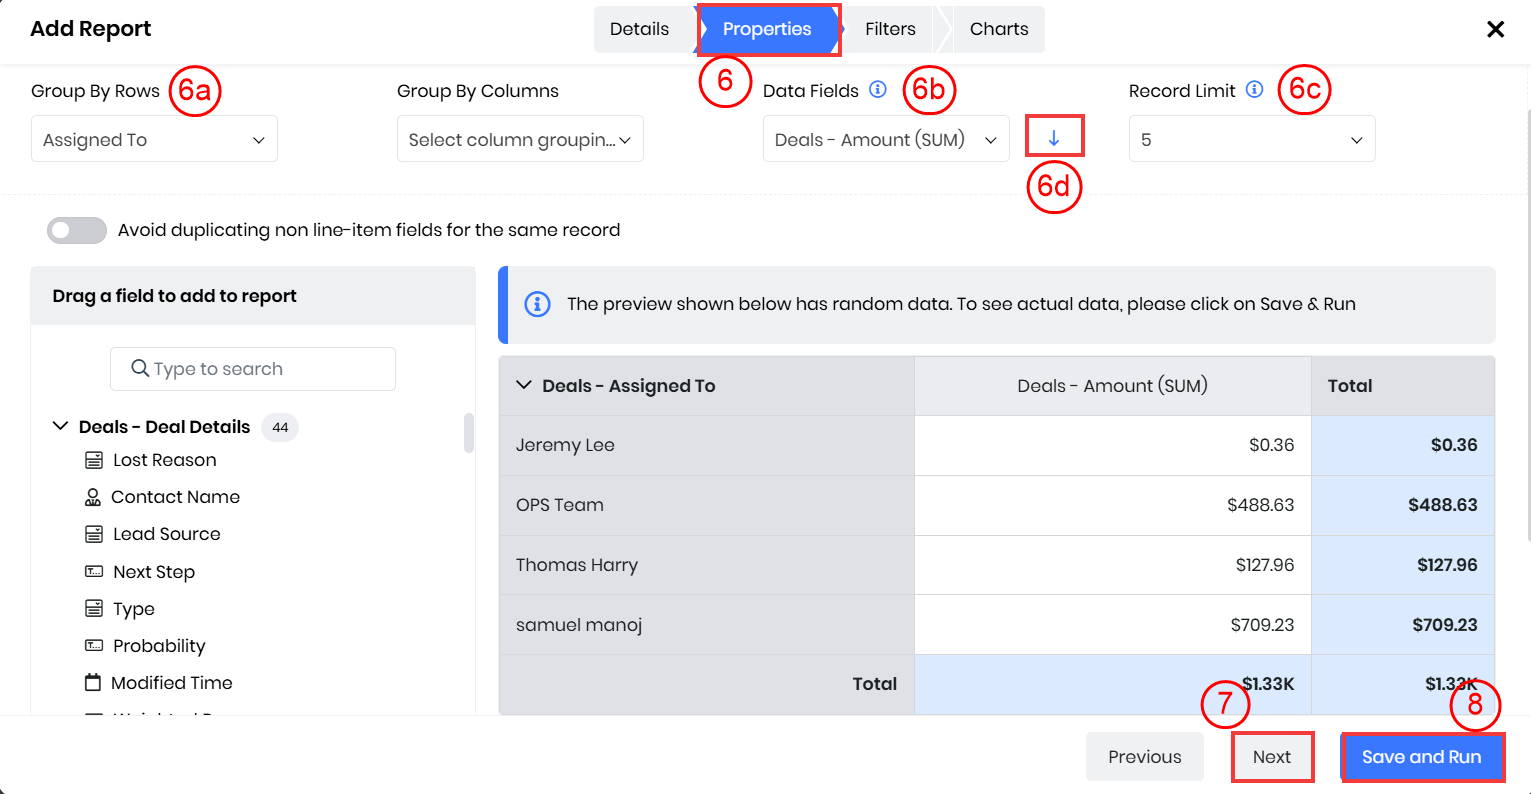
- Enter or select the following information in the Properties tab:
- Group By Rows: Select the Group by Row as Assigned To.
- Data Fields: Select the data fields as Amount (SUM).
- Record Limit: Select the Record Limit to display the top 5 records
- Click the down arrow to sort by highest deal value (Top-N).
- Click Next to specify filters and generate charts.
- Click Save and Run.
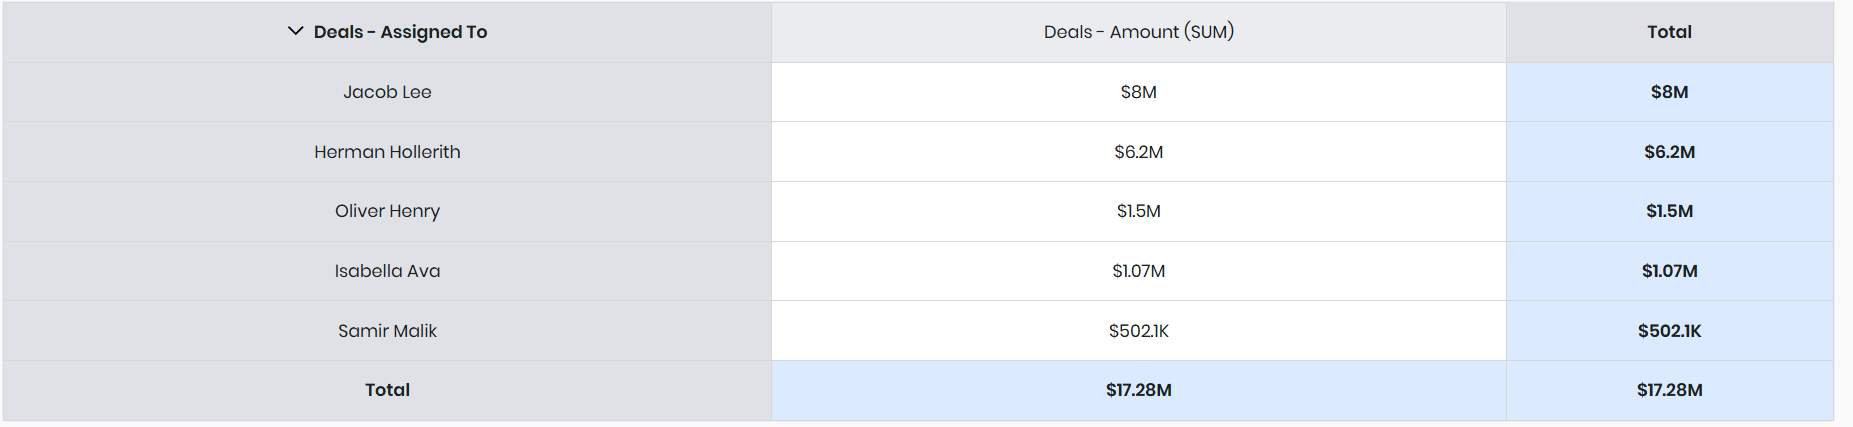
The report displays the top 5 sales representatives based on total deal value, ordered in descending order.
Scheduling a Report
Follow these steps to schedule a report:
- Log in to the CRM.
- Click the Main Menu.
- Go to Essentials.
- Select Reports.
- Select and open the report you want to schedule from the List View.
- Click the More icon on the top right corner of the screen.
- Select Schedule Report.
- Enter or select the following information:
- To - Select the users, groups, or roles to whom you want to send an email.
- Cc - Select other users to whom you want to send an email.
- Frequency - Select when you want to send the report (daily, weekly, monthly, yearly, or on a specific date).
- Monthly recurrence - Select the dates when you want the report to be updated.
- Start Time - This lets you choose when the report must be sent.
- File Format - Select the format you want to receive the report (CSV, Excel, or PDF).
- Send email even if the report is blank - Sometimes, if the report is blank, enabling this option still sends the report at the scheduled time.
- Click Save
Selecting PDF Orientation for Scheduled Reports
You can choose the PDF orientation when scheduling a report. This option lets you select the layout that best fits your report's content. When you select PDF as the report format in a scheduled report, the system displays an Orientation field below it.
In the Orientation field, you can choose one of the following options:
- Portrait
- Landscape
The system selects Portrait mode by default. You can change it to Landscape based on your reporting requirements.
Actions Possible on Reports
You can perform the following actions on a report:
- Duplicate: Using this option, you can create a separate or duplicate report with the same report content and a different report name.
- Print: This option allows you to print the entire report.
- Schedule Report: You can schedule reports at a fixed time and frequency by using this option. Skip to this section to learn more about scheduling reports.
- Share Report: You share the report with your teammates by using this option.
- Export: You can export a report in either CSV or Excel format.
- Send Email: You can send the report as an attachment via email by using this option.
- Subscribe: Click this option to subscribe to the report if it is shared with you. You can unsubscribe from the report at any time.
Difference between subscribing to a report and scheduling a report
- You can subscribe to a report owned by another user if he or she has shared the report with you. Also, if the user has scheduled report emails for you, you can use the Unsubscribe option to stop receiving emails.
- You can schedule a report only if you are its owner. If you share the report with a user and do not set up report emails for him or her, he or she can subscribe to receiving report emails by using the Subscribe option.
User-Based Scheduled Reports
You can receive scheduled report emails with attachments that show only the records you are allowed to access. This helps you quickly review relevant data without logging in to the CRM.
The system generates scheduled reports based on the selected CRM user’s (report owner’s) permissions. The report attachment includes only the records and fields that the user has access to view. This ensures the system respects role hierarchy, sharing rules, and field-level permissions defined for each user.
When you click Schedule Report, you will see the Run Report As option.
- Admin users can select any user.
- Non-admin users can select themselves or users who are lower in the role hierarchy.
Exporting a Report
Follow these steps to export a report:
- Log in to the CRM.
- Click the Main Menu.
- Go to Essentials.
- Select Reports.
- Select and open the report that you want to export.
- Click the Export icon located on the top right of the report.
- Choose a format.
Actions Possible on Charts
To perform actions on a chart, click the ellipsis displayed on the top right. You will see the following options:
- Edit: You can use this option to edit report details.
- Post Chart: Use this option to post the chart in a comment and mention a user or a group.
- Save as Image: This option allows you to download the chart as an image in PNG format.
- Print: Using this option, you can print the chart on paper.
- Pin to Dashboard: This option allows you to pin the chart to one of your dashboards.
- Sort Charts: You can sort data in ascending or descending order for X-axis values. This is available for Pie, Line, Bar, and Column charts and for the following values:
- Date
- Date & Time
- Time
- Integer
- Decimal
- Year
- Month