Articles in this section
Generating Chat Insights
Feature Availability
Vtiger Editions: One Pilot | One Professional | One EnterpriseIntroduction
The Chat Insights feature gathers information about your team’s interaction with customers through Live Chats.
Chat Insights consists of widgets that display data in charts. Each chart shows specific information related to your team’s performance and progress. Generate essential metrics such as conversations per day, per hour, response to chats, agent rating, customer feedback, and more with Chat Insights. This module helps team managers and supervisors get a summary of your team’s performance. This will enable you to find ways to improve the team’s performance.
To learn more about Live Chats, click here.
Filters in Chat Insights
You can personalize the metrics view using Filters. Chat Insights provides an option to view the metrics filtered by groups, agents, and time period. For example, you can view your team's performance or a specific agent's performance in the last two weeks.Note: The filters that you set are applied to all the charts and metrics.
Accessing Chat Insights
Follow these steps to view Chat Insights:
- Log in to the CRM.
- Click the main Menu.
- Go to Help desk.
- Go to Customer Service Analytics.
- Click Chat Insights.
Key Terminology
| Key Term | Definition |
| Chat Insights | Chat Insights consists of widgets that display data in charts. |
| Widget | A widget refers to a small application or component that provides specific functionality and can be added to different areas of the CRM interface. |
Using Filters to Display Data
Note: The filters that you set are applied to all the charts and metrics.
Follow these steps to use these filters:
- Log in to the CRM.
- Click the main Menu.
- Go to Help desk.
- Go to Customer Service Analytics.
- Click Chat Insights. The Chat Insights page opens.
- Click the Groups drop-down at the top of the screen.
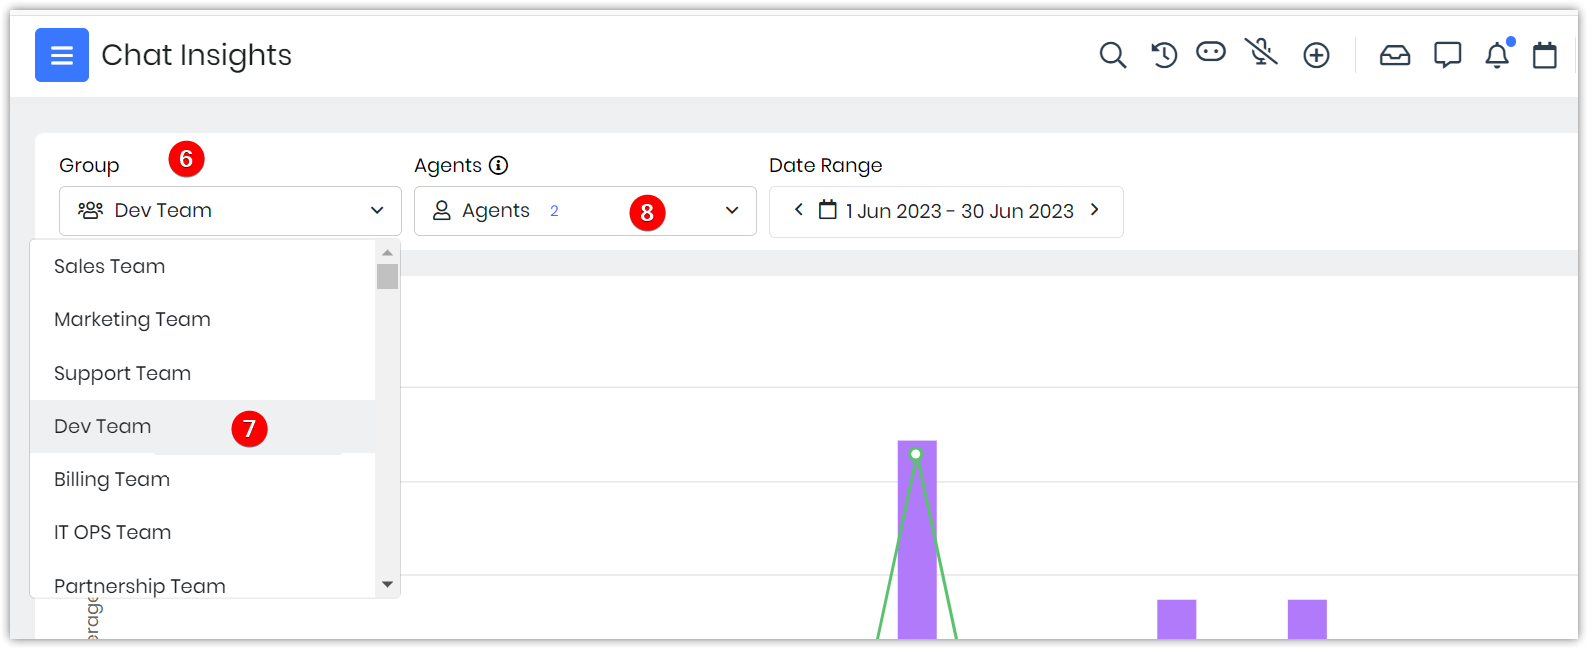
- Select the team.
- Click the Users drop-down.
- Select the agents.
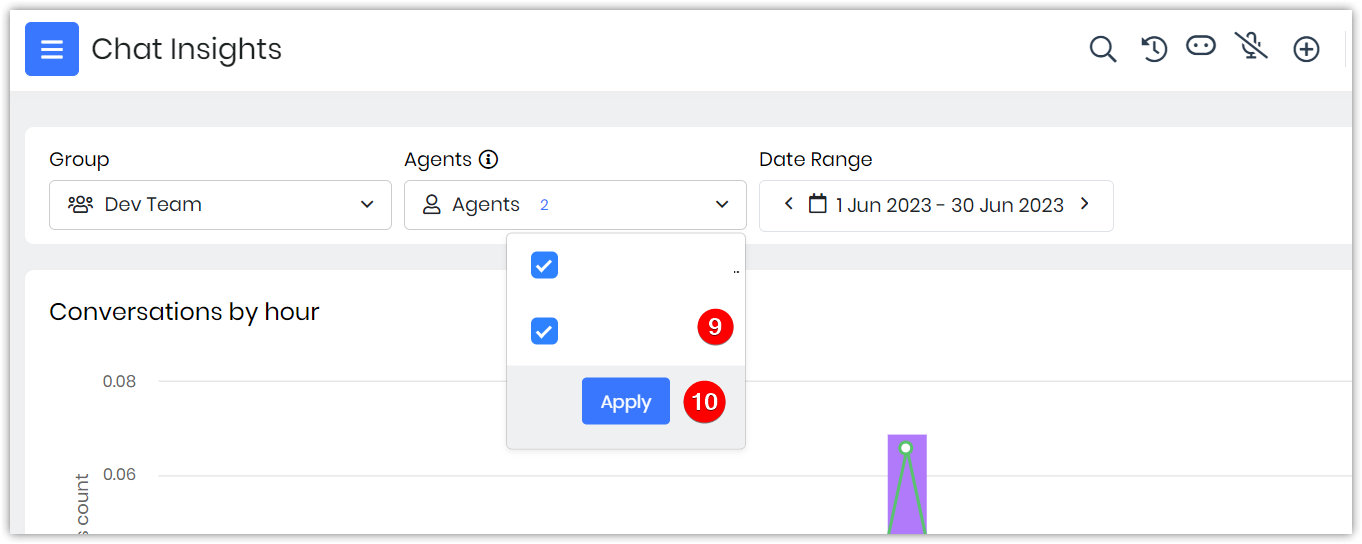
- Click Apply.
- Click the date range drop-down.
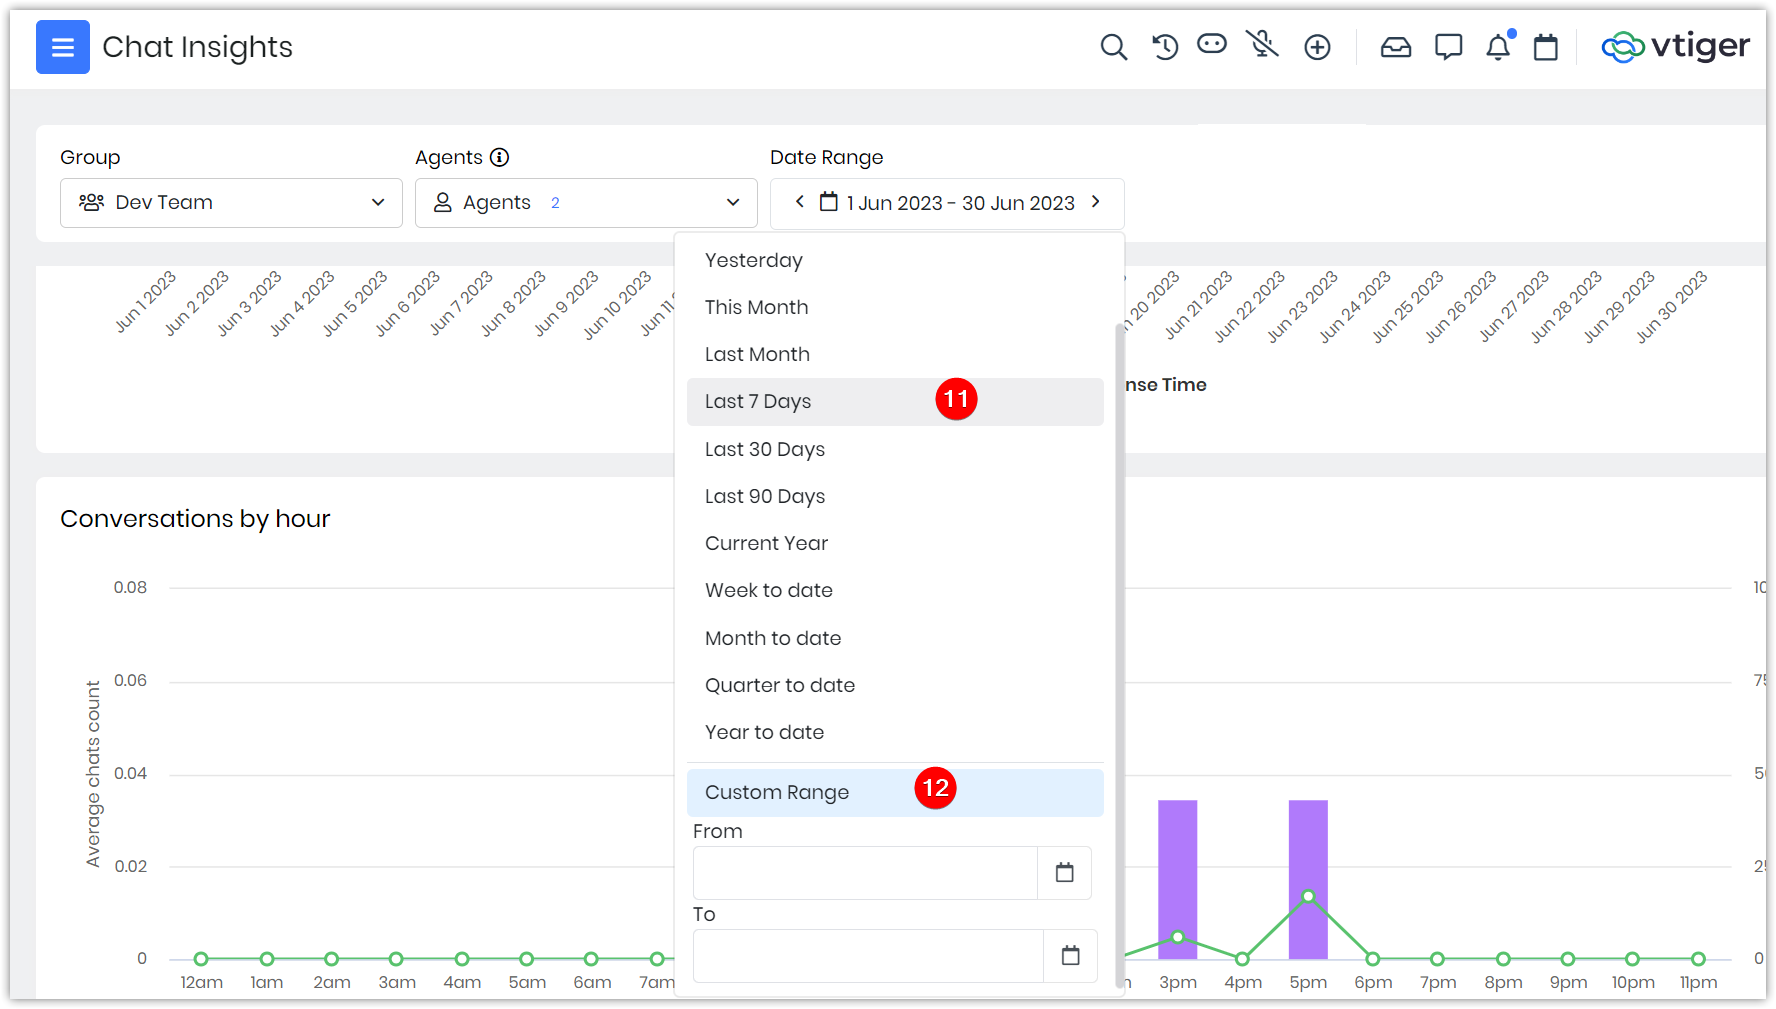
- Select an option or enter a custom range.

- Click Apply.
Viewing Details in the Summary Section
After you move past the filters section, you will find the Summary section that displays the essential metrics briefly. These metrics depend on the filters you have set previously.
You can see five blocks here:
- Responded Conversations - This block shows the number of conversations the agents have answered in the selected time period.
- Missed Conversations - This block shows the number of conversations the agents have missed in the time period set in the filters.
- Chat Duration - This block shows the total time agents spend on chats in the selected time period.
- Chat Rating - This block shows the average rating given by customers to chats in the time period set in the filters.
- Avg Response Time - This block shows the average response time of the agents in the selected time period.
Each block also shows the percentage increase or decrease in the metrics compared to the previous time range. If it is good progress, the arrow is green; otherwise, it is red.
Consider this example.

Here you can see the metrics summary of a single day (Sept 22, 2020) and the agents active (7) on that day. The increase and decrease in numbers are shown in colored arrows.
- The number of responded conversations has increased by 34% when compared to the previous day. This is good news for the company because the response conversations by agents must be higher. Hence, the arrow is in green.
- The number of missed conversations has increased by 164% when compared to the previous day. This is bad news for the company because missed conversations must be fewer. Hence, the arrow is in red.
- The chat duration decreased by 27% compared to the previous day. This is bad news for the company because the shorter the chat, the better the experience. Hence, the arrow is in red.
- The average chat rating has increased by 1% when compared to the previous day. This is good news for the company because it shows that the customers are satisfied with your service. Hence, the arrow is in green.
- The average response time has decreased by 5% when compared to the previous day. This is good news for the company because it shows that your agents are up and running and actively responding to the chats. Hence, the arrow is in green.
Using Widgets to View Data
Widgets are the highlights of this module. Chat Insights is all about the metrics that are shown in these widgets.
| Widgets | Description |
| Conversations by day | A column chart that shows the average response time (in seconds) to the chat count per day. Metrics shown:
|
| Conversations by hour | A column chart that shows the average response time (in seconds) to the average chat count per hour.
|
| Hourly response time with the number of conversations | A column chart that shows the average number of conversations and the response time by the agents on an hourly basis.
|
| Response time by the agent | A column chart shows the average number of chats each agent receives per day and their average response time.
|
| Agent Chat Volume | A bar chart that shows the number of chats attended by each agent. |
| Chat duration by agent | A column chart shows each agent's average duration on Web Chats. You can find other metrics when you hover over each agent.
|
| Chat Rating by agent | A table that shows the customer and reviewer rating of every chat and the agent who handled the issue.
|
| Customer Satisfaction | A pie chart that shows customer satisfaction percentage based on customer ratings. Metrics shown:
|
| Customer Feedback | A list that shows feedback written by customers about their interactions with an agent's name. |
|
|

In the screenshot below, the Average chats count label is greyed out because the chart is not displaying data on the average number of chats.
Most charts show data that are grouped based on multiple aspects. For example, the Response time by agent chart data is grouped by the average chat(s) count and the average response time. If you do not want to view the data on average chat count, you can click on the label provided at the bottom of the chart.